Inventory Management System DFD Levels 0, 1, 2 is the single most common BSIT capstone topic in 2026. Cafeteria inventory, drugstore inventory, sari-sari store inventory, warehouse inventory. at least one group in every batch picks some version of it.
And in Chapter 3, the diagram panels look at first is the Data Flow Diagram.
Most students get it wrong in three predictable ways.
- They confuse the levels.
- They mix up external entities with processes.
- They skip Level 2 entirely because nobody told them what it should contain.
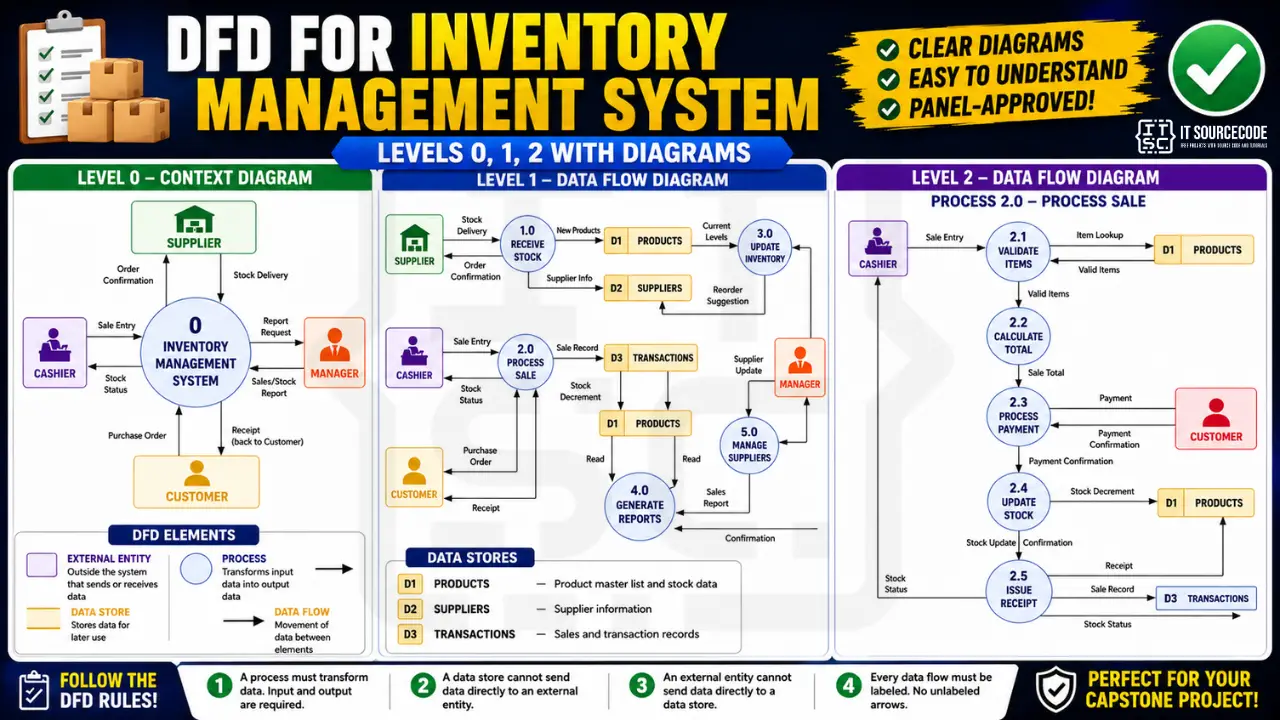
This guide walks through Levels 0, 1, and 2 with complete worked examples you can adapt to your own inventory project. pharmacy, retail, warehouse, school supplies, whatever variant your capstone is.
By the end, you’ll have the DFD set your Chapter 3 needs.
What a DFD actually shows
A Data Flow Diagram shows how DATA moves through a system. Notice the emphasis. DFDs are not flowcharts. They don’t show control flow or decision points or loops. They show what data goes where, who sends it, who receives it, and where it gets stored.
DFDs live in Chapter 3, Section 3.6 (System Design) of your capstone documentation. Most BSIT schools require at least Level 0 and Level 1. Stronger documentation includes Level 2 for one or two complex processes.
If your school requires UML diagrams instead of DFDs, see our UML guides hub. DFDs are technically structured analysis tools, not UML, but Filipino BSIT programs almost universally treat them as required documentation alongside UML.
The 4 elements of every DFD
Four building blocks. Memorize these. every DFD is made of just these four things.
1. External Entity (rectangle)
Anyone or anything OUTSIDE your system that sends or receives data. People, organizations, other systems.
Examples for an inventory system:
- Supplier
- Customer
- Manager
- Cashier
- External payment gateway
External entities go in rectangles. Their name is usually a noun phrase like “Cashier” or “Supplier.”
2. Process (circle or rounded rectangle)
Something inside your system that DOES WORK on data. Transforms input into output.
Examples:
- Receive Stock
- Process Sale
- Generate Report
- Validate Payment
Every process must have at least one input AND at least one output. A process with input but no output is called a “black hole.” A process with output but no input is called a “miracle.” Both are bugs and panels catch them.
Processes use a circle in Yourdon notation, or a rounded rectangle in Gane-Sarson notation. They’re numbered: 1.0, 2.0, 3.0 at Level 1; 2.1, 2.2, 2.3 at Level 2.
3. Data Store (open-ended rectangle or two parallel lines)
Where data is stored. In code terms: a database table, a file, a cache.
Examples:
- D1 Products
- D2 Suppliers
- D3 Transactions
Data stores get an identifier (D1, D2, D3) and a name. They sit and hold data. They cannot send data directly to external entities. only processes can do that.
4. Data Flow (labeled arrow)
The actual data moving between elements. Every arrow needs a label describing what data flows.
Good labels: “Sale Entry,” “Stock Update,” “Receipt,” “Low Stock Alert”
Bad labels: “data,” “information,” “stuff”
Unlabeled arrows are the most common DFD mistake. Every flow needs a name.
The four DFD rules
These rules constrain what can flow where. Memorize them.
- A process must transform data. Input goes in, output comes out. Both required.
- A data store cannot send data directly to an external entity. It must go through a process first.
- An external entity cannot send data directly to a data store. It must go through a process first.
- Every data flow must be labeled. No unlabeled arrows.
If you follow these four rules, your DFD will pass most panel reviews on the diagram structure alone.
Two notation systems: Yourdon vs Gane-Sarson
Two common notation styles. Most PH BSIT schools accept either. Pick one and stay consistent across all three levels.
| Element | Yourdon | Gane-Sarson |
|---|---|---|
| External Entity | Rectangle (square) | Rectangle with shadow |
| Process | Circle | Rounded rectangle |
| Data Store | Two parallel horizontal lines | Open-ended rectangle |
| Data Flow | Arrow with label | Arrow with label |
Yourdon (circles for processes) is more common in Filipino BSIT capstones. Gane-Sarson (rounded rectangles) is more common in business systems analysis.
This guide uses Yourdon notation. Convert to Gane-Sarson if your school prefers it.
Inventory Management System: the example context
For this guide, we model a small business inventory system. Adapt the entities, processes, and data stores to your specific capstone (pharmacy, cafeteria, retail, warehouse, etc.).
External entities (4):
- Supplier. delivers stock, receives orders
- Customer. buys products, receives receipts
- Cashier. enters sales, sees stock status
- Manager. requests reports, manages suppliers
Main processes (5):
- 1.0 Receive Stock
- 2.0 Process Sale
- 3.0 Update Inventory
- 4.0 Generate Reports
- 5.0 Manage Suppliers
Data stores (3):
- D1 Products
- D2 Suppliers
- D3 Transactions
This is a typical scope for a 12-week BSIT capstone. More features = more processes; more data = more stores.
Level 0: Context Diagram
Level 0, also called the Context Diagram, shows the ENTIRE system as a single process bubble. No internal detail. Just the system, the external entities, and the major data flows between them.
The point of Level 0 is to define the boundary of your system. Everything inside the bubble is what you’ll build. Everything outside is what you’ll interact with.
Level 0 description
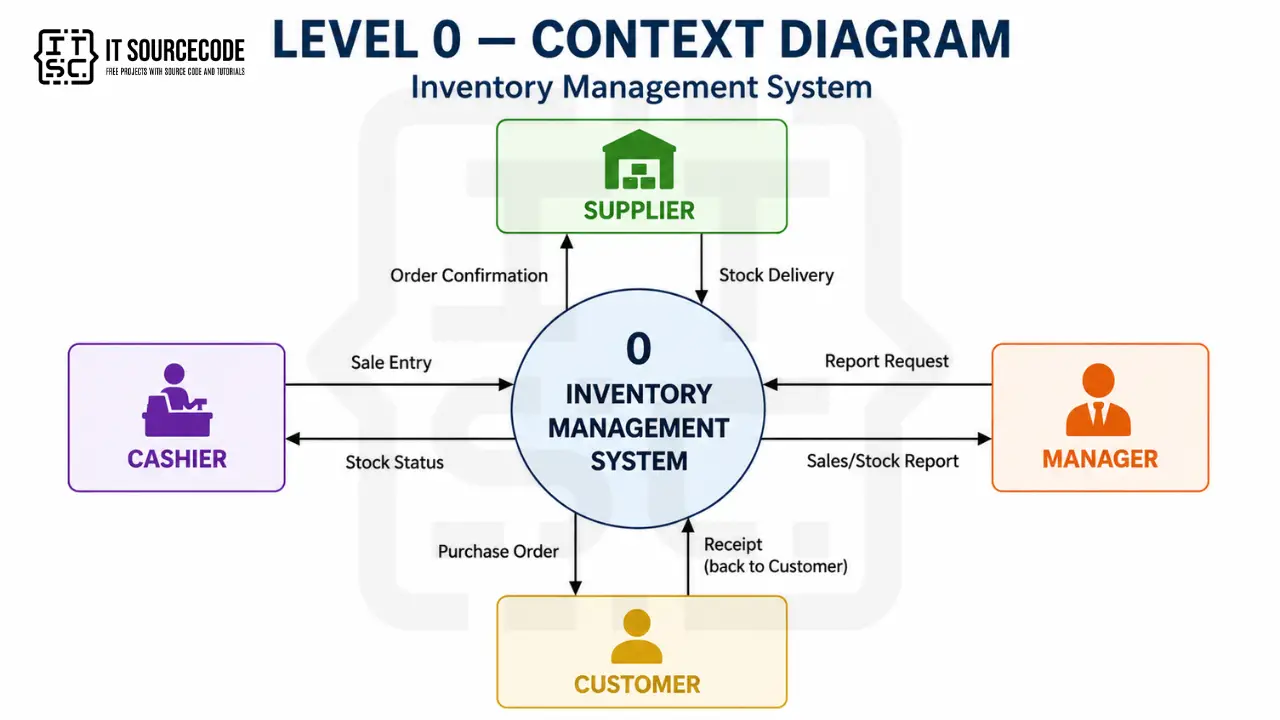
Figure 3.1. Level 0 Data Flow Diagram of the Inventory Management System.
What’s in Level 0
- One process bubble labeled “0” or “Inventory Management System”
- All 4 external entities (Supplier, Customer, Cashier, Manager)
- Labeled data flows between each entity and the system
- NO data stores at Level 0 (data stores only appear from Level 1 onwards)
Explanation:
Figure 3.1 presents the Level 0 Data Flow Diagram of the proposed Inventory Management System. Four external entities interact with the system: Suppliers (who deliver stock and receive order confirmations), Customers (who place purchase orders and receive receipts), Cashiers (who record sales and view stock status), and Managers (who request reports and receive sales and stock summaries).
The Level 0 diagram establishes the system boundary and the major data exchanges with each external entity, without showing internal processes or data stores.
Level 1: Main Processes
Level 1 takes the single Level 0 bubble and decomposes it into the main processes that make up the system. This is where data stores first appear.
For our inventory system, Level 1 shows the 5 main processes, all 3 data stores, and all the labeled data flows between processes, entities, and stores.
Level 1 description
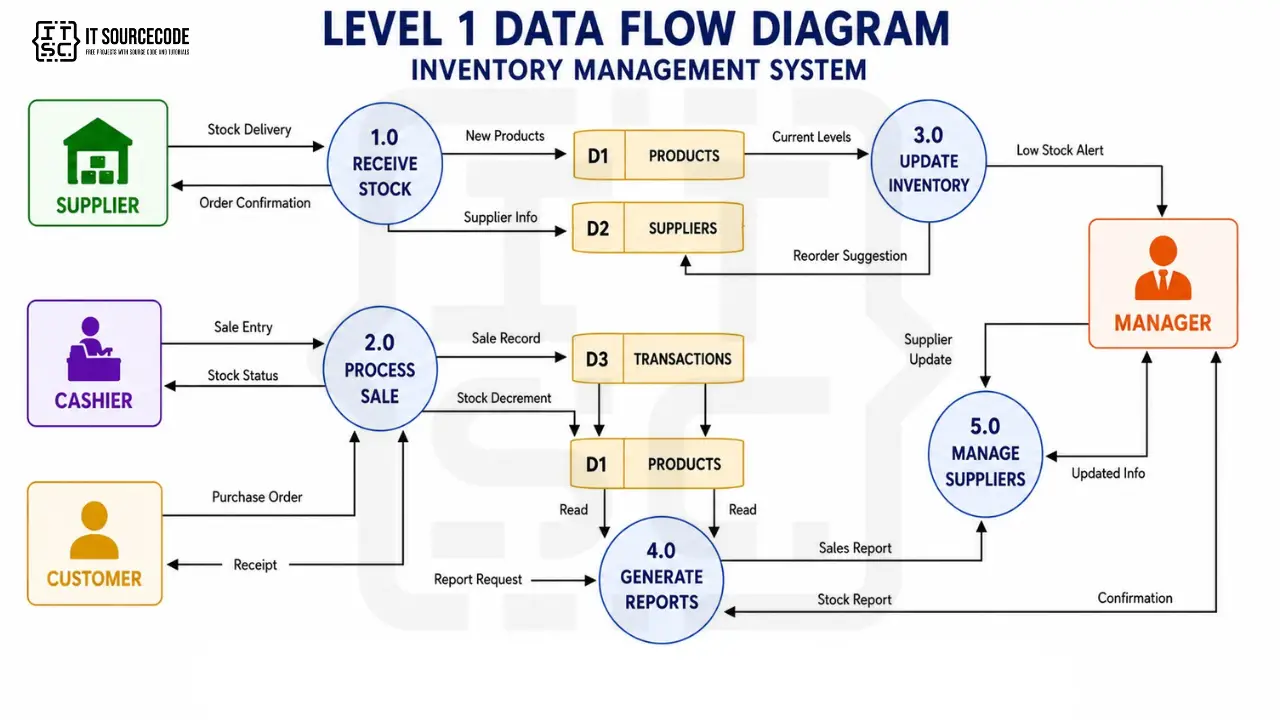
Figure 3.2. Level 1 Data Flow Diagram of the Inventory Management System.
What’s in Level 1
- 5 process bubbles (1.0 through 5.0), each labeled
- All 4 external entities from Level 0
- All 3 data stores (D1, D2, D3)
- Every data flow labeled
Process explanations
1.0 Receive Stock. Accepts incoming stock deliveries from suppliers, records new products in D1, updates supplier information in D2, and sends order confirmation back to the supplier.
2.0 Process Sale. Handles sales transactions from cashiers and customers, decrements stock in D1, records the transaction in D3, issues a receipt to the customer, and shows current stock status to the cashier.
3.0 Update Inventory. Monitors current stock levels from D1, generates low-stock alerts when items fall below threshold, and writes reorder suggestions to D2 for the supplier management process.
4.0 Generate Reports. Responds to manager report requests by reading from D1 (current stock) and D3 (transaction history), producing both sales reports and stock reports.
5.0 Manage Suppliers. Allows managers to add, edit, or remove supplier records in D2, with confirmation feedback.
Level 2: Subprocess Decomposition
The Level 2 takes ONE Level 1 process and decomposes it further. You don’t need a Level 2 diagram for every Level 1 process. only the complex ones that benefit from showing internal subprocesses.
For our system, we’ll decompose Process 2.0 (Process Sale) because it has the most internal logic.
Level 2 description. Process 2.0 (Process Sale)

Figure 3.3. Level 2 Data Flow Diagram of Process 2.0. Process Sale.
What’s in Level 2
- 5 subprocess bubbles (2.1 through 2.5), numbered as children of 2.0
- The same external entities and data stores that touch Process 2.0
- Detailed internal data flows showing the sequence of operations
Subprocess explanations
2.1 Validate Items. Checks that each item the cashier entered exists in D1 Products and is in stock. Returns the validated item list with current prices.
2.2 Calculate Total. Sums up the validated item prices, applies any discounts, computes tax, and produces the final sale total.
2.3 Process Payment. Accepts payment from the customer (cash, card, GCash, etc.), validates the amount, and confirms payment.
2.4 Update Stock. Decrements the stock quantity in D1 Products for each sold item, and confirms the update.
2.5 Issue Receipt. Generates a receipt for the customer, records the complete transaction in D3 Transactions, and updates the cashier with the current stock status.
Why Level 2 matters
Without Level 2, the panel sees “Process Sale” as a single black-box bubble in Level 1. They can’t tell whether you actually thought through the steps of a transaction. Level 2 shows you understand the workflow at a fine-grained level.
You don’t need Level 2 for every Level 1 process. Pick the 1-2 most complex ones. For inventory, “Process Sale” is the obvious candidate. “Generate Reports” might also benefit from Level 2 if your reports are complex.
Common DFD mistakes that get sent back
Eight patterns we’ve seen kill DFD sections in BSIT capstones:
- Black hole process. Data goes in, nothing comes out. Every process needs at least one input AND one output.
- Miracle process. Data comes out, nothing went in. Same fix as black hole. every process needs balanced flows.
- External entity sending data directly to a data store. Not allowed. The data must go through a process first.
- Data store sending data directly to an external entity. Same rule, other direction. The data must pass through a process.
- Unlabeled data flows. Every arrow needs a name. “Data” or “Info” is not a name. Use specific names like “Sale Entry” or “Stock Update.”
- Inconsistent numbering between levels. Process 2.0 in Level 1 must explode to 2.1, 2.2, 2.3 in Level 2. Not to 3.1 or 1.1.
- Level 0 with multiple process bubbles. Level 0 is ONE bubble representing the entire system. If you have two bubbles at Level 0, you’re actually drawing Level 1.
- Drawing all levels at the same detail. The whole point of levels is progressive decomposition. If your Level 0 has 5 processes, you skipped a level.
How to draw your DFD: tool recommendations
draw.io (free, recommended). best for capstones
- Built-in DFD shape libraries (both Yourdon and Gane-Sarson)
- Free, no signup, works in browser
- Export to PNG, PDF, or SVG
- Save to Google Drive for team collaboration
Lucidchart (free tier). best for teams
- Real-time collaboration
- 3 documents free, 60 shapes per document
- Enough for a complete Level 0 + Level 1 + Level 2 set
Microsoft Visio. if your school has Microsoft 365 Education license
- Professional output
- More features than needed but very capable
Pen and paper. for initial sketching
- Sketch all three levels by hand first
- Then redraw in draw.io or Lucidchart for the final document
What to avoid: PowerPoint shapes, Word built-in shapes, MS Paint. The output looks unprofessional and panels notice immediately. Use a real diagramming tool.
How to put your DFD in Chapter 3
Where each diagram goes:
- Chapter 3, Section 3.6 (System Design). embed Figures 3.1 (Level 0), 3.2 (Level 1), and 3.3 (Level 2) in this section
- Each figure gets a numbered caption below it
- Each figure gets a 1-2 paragraph explanation above it in the body text
Caption format:
Figure 3.1. Level 0 Data Flow Diagram of the [Your System Name].
Figure 3.2. Level 1 Data Flow Diagram of the [Your System Name].
Figure 3.3. Level 2 Data Flow Diagram of Process X.0. [Process Name].
The explanation paragraph should:
- Name the external entities
- Name the major processes (Level 1+)
- Name the data stores (Level 1+)
- Point out any non-obvious data flows or design decisions
For Chapter 3 structure overall, see our Chapter 3 Methodology guide.
How to customize for your specific inventory system
The processes, entities, and data stores change based on what kind of inventory system you’re building. Eight common BSIT inventory capstones:
- Pharmacy/drugstore inventory. add Expiry Date Tracking, Prescription Validation, Controlled Substance Logging
- Cafeteria/canteen inventory. add Menu Item Creation, Daily Specials, Ingredient-to-Menu Mapping
- Sari-sari store inventory. simplify processes, add Credit Tracking (“listahan”), Daily Cash Tally
- Warehouse inventory. add Location Tracking (zone/shelf/bin), Pick-and-Pack Workflow, Multi-warehouse Sync
- Hospital pharmacy inventory. add Doctor Verification, Patient History Linkage, Cold-Chain Logging
- School supplies inventory. add Teacher Requests, Approval Workflow, Quarterly Budget Tracking
- E-commerce inventory. add Online Order Sync, Multi-channel View, Backorder Handling
- Bookstore inventory. add ISBN Lookup, Reservation System, Edition Tracking
For each variant, add 1-2 new processes to Level 1 and adjust the data stores accordingly. The Level 0 boundary usually stays similar; the internal complexity grows.
If you want a working code reference to study before drawing your DFD, see our Inventory Management System in PHP source code post. the database schema there maps directly to the data stores in your DFD.
Free download: DFD template
Working inventory management source code that implements this diagram
The diagram above defines the flows; these are the actual inventory management systems on itsourcecode.com that implement them. Pick one in your team’s stack and you have a working reference to point your panel at when they ask “show me where this flow actually runs in code.”
PHP (POS): POS in PHP with Stock Tracking
Vanilla PHP + MySQL. Point of Sale handles stock-in / stock-out at the counter, matches Level 0/1 process flows.

Java: Inventory Management System in Java
Java Swing + JDBC + MySQL. Strong fit for OOP-track defense and NetBeans-style demo.
ASP.NET: Inventory Management System in ASP.NET
C# + SQL Server. Clean DataStore-to-Repository pattern for panel walkthrough.
VB.NET: Sales and Inventory in VB.NET
VB.NET + MySQL. Windows Forms with barcode-ready stock-keeping + receipts module.

Django (Python): Django Inventory Management
Django 4 + Bootstrap. Model classes map directly to Level 2 data stores.

Laravel (PHP): Inventory Management in Laravel
Laravel + Tailwind. Eloquent makes the stock-movement audit trail trivial to defend.

CodeIgniter (PHP): Inventory Management in CodeIgniter
CI4 + Bootstrap. MVC upgrade path from vanilla PHP without leaving the LAMP stack.
How to use this for your Chapter 3 (Methodology): download the project in your stack, then map each process and data store in this diagram to a specific module, controller, or table in the downloaded source. That mapping IS the bridge between your design chapter and your implementation chapter, the single thing panels want to see traced end to end.
Official documentation
Working source code for this system
Download the actual implementation of this system in your preferred language. Each project includes source code, database, and setup instructions for BSIT capstone use.
- PHP: Stock Management System in PHP with Source Code
- VB.NET: Sales and Inventory Management System Project in VB.Net Source Code
- Java: Stock Management System Project in Java with Source Code
- Python: Django Warehouse Management System with Source Code
- Django: Django Warehouse Management System with Source Code
- Laravel: Inventory Management System in Laravel With Source Code
Frequently Asked Questions
What are the 4 elements of a Data Flow Diagram?
What is the difference between Level 0, Level 1, and Level 2 DFDs?
What is a context diagram in a DFD?
How many processes should be in a Level 1 DFD?
Where do DFDs go in capstone documentation?
What is the difference between Yourdon and Gane-Sarson notation in DFD?
How do I customize the inventory DFD for a pharmacy or sari-sari store?
What tool should I use to draw the DFD for my capstone?
Should I draw Level 2 DFDs for every Level 1 process?
Final Recommendation: Sketch Level 0 today, Level 1 by Friday, Level 2 by Monday
DFDs are not the hard part of Chapter 3. They look intimidating because of the formal notation, but the actual content. what data moves where. is just your project’s design. Sketch it on paper first. Then open draw.io and redraw it cleanly.
By the time you have all three levels done, you’ll understand your system better than 90% of teams who skipped this exercise.
For the full Chapter 3 methodology this DFD lives in, see our Chapter 3 Methodology guide. For the broader documentation structure, see our Capstone Chapter 1-5 Template. And, for other diagram types your panel will ask about, our UML guides hub covers every diagram type.
If you haven’t picked your capstone topic yet, browse 150 Best Capstone Project Ideas for IT Students 2026. For a working code example of an inventory system in PHP, see our Inventory Management System source code.
By the way, after you finish your DFD, you might also need other diagrams for Chapter 3. We have guides for the Use Case Diagram, Class Diagram, Activity Diagram, and Sequence Diagram. All are common requirements in Chapter 3 alongside the DFD.
I hope this article helps you defend your capstone successfully. If you have any questions or suggestions regarding this topic about DFDs for Inventory Management Systems, please feel free to contact me at our contact page. Or, you can also add me on Facebook at https://www.facebook.com/joken.villanueva.
Now open draw.io. Drop one big bubble. Add your external entities. That’s Level 0 done.

Caren Bautista
Technical Writer at PIES IT Solution
Responsible for crafting clear, well-structured, and beginner-friendly content across the platform. Handles the writing, proofreading, and editorial review of tutorials, guides, and documentation to ensure every article is accurate, readable, and easy to follow.
Expertise: Technical Writing · Content Creation · Documentation · Editorial Writing · JavaScript · TypeScript · Python · Python Errors · HTTP Errors · MS Excel
· View all posts by Caren Bautista →