DFD for Hotel Management System – Data Flow Diagram

Best Data Flow Diagram Hotel Management System DFD Level 0-1-2

The DFD for Hotel Management System is an overall flow of how the data moves through a system, describing its inputs and outputs process within the entire system. Furthermore, the data flow …

Read more

DFD for Doctor Appointment System | Data Flow Diagrams

Best Data Flow Diagram - Doctor Appointment System DFD Level 0 1 2 - 2021

The DFD for Doctor Appointment System is the overall flow of data on the project. It is used to document the transformation of data (input-output) for project development. This doctor …

Read more

DFD for Bus Reservation System (Data Flow Diagram)

Best Data Flow Diagram - Bus Reservation System DFD Level 0 1 2 - 2021

The DFD for Bus Reservation System is the visualization of data processing on the project. It is used to document the transformation of data (input-output) of the project development. In …

Read more

Frequently Asked Questions

What are the levels of a Data Flow Diagram?
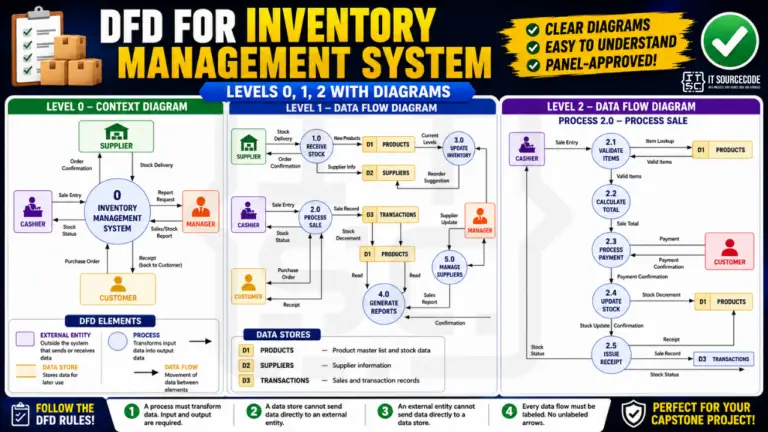
DFDs are hierarchical. Level 0 (Context Diagram) shows the entire system as a single process with external entities. Level 1 decomposes that single process into 5-8 major sub-processes with data stores between them. Level 2 further decomposes each Level 1 process into more detailed sub-processes. Most BSIT capstones submit Level 0, 1, and 2 — going deeper is over-scope.
What is the difference between DFD and Flowchart?
DFD shows DATA movement — what data goes where, where it is stored, who produces or consumes it. It has 4 symbols (entity, process, data store, data flow). Flowchart shows CONTROL flow — decision logic, sequence, loops. It has many symbols (decision diamond, process rectangle, terminator oval). For capstone Chapter 3, you typically need a DFD for the data model and a Flowchart (or Activity Diagram) for specific algorithms.
What is the difference between DFD and UML Activity Diagram?
DFD is data-centric — focus on what data is processed and stored, by which process. Activity Diagram is workflow-centric — focus on the sequence of actions, decision branches, parallel work. Many BSIT capstones include BOTH. Older curricula favor DFD (structured systems analysis); newer/OOP curricula favor Activity Diagrams. Check your school's documentation template.
What free tool should I use to draw a DFD?
draw.io / diagrams.net — free, web-based, has a built-in DFD shape library (Gane-Sarson and Yourdon-DeMarco notations). Lucidchart Free — prettier output. Visual Paradigm Community — full DFD support with leveled decomposition. PlantUML supports DFD via plugins. Start with draw.io for capstone — fastest iteration.
Gane-Sarson vs Yourdon-DeMarco notation — which to use?
Gane-Sarson uses rounded rectangles for processes (most common in Philippines BSIT curricula). Yourdon-DeMarco uses circles for processes (older, common in some Indian and US universities). Both are valid. Pick whichever your school's documentation template uses. The semantics are identical — only the shape choice differs.
Are these DFDs free for capstone and thesis use?
Yes. All DFDs are free to download, modify, and submit. No attribution required for academic use. Adapt the external entities, processes, and data stores to your specific system — that is expected good practice.
How often is this DFD collection updated?
New DFDs are added regularly as we encounter new capstone domains (Face Recognition systems, IoT, Cloud-based services). Existing DFDs are reviewed and updated periodically. Last refreshed: May 2026.