Chapter 3 methodology capstone is where your engineering becomes documentation. It’s also the chapter most BSIT students get wrong in one of two specific ways.
Some students treat it as a coding chapter and forget the research design completely. No respondents, no sampling, no statistical treatment.
Other students treat it as a pure research chapter and forget the UML diagrams that are supposed to live here.
Both versions get sent back for revision.
The defensible version has both halves. Research design AND software development methodology. Sampling description AND UML diagrams. Statistical treatment AND ethics paragraph. This guide walks through each subsection so you can write Chapter 3 without sending it back to your adviser three times.
If you’ve already worked through our Chapter 1-5 Template, this is the deep-dive into the single chapter that takes the most time and gets the most feedback. Plan a full weekend for Chapter 3 alone.
What Chapter 3 actually does
Four things every Chapter 3 must accomplish:
Documents HOW you built and tested your project. Not just the code: the entire research process from data collection to system development to evaluation.
Provides reproducibility. Another student team in another year should be able to follow your Chapter 3 and roughly recreate your study. If they can’t, it’s not detailed enough.
Justifies your technical choices:
- Why Random Forest, not deep learning.
- Why PHP, not Python.
- Why purposive sampling, not random.
- Every choice needs a one-sentence justification.
Houses all your UML diagrams. This is where Use Case, DFD, ERD, Class, Activity, and Sequence diagrams live. Without them, Chapter 3 fails review.
Part of our complete capstone documentation series:
- Chapter 1: Introduction
- Chapter 2: Review of Related Literature (RRL)
- Chapter 3: Methodology (You are here)
- Chapter 4: Results and Implementation
- Chapter 5: Summary, Conclusions, and Recommendations
- Full Chapter 1-5 Template (Free Download)
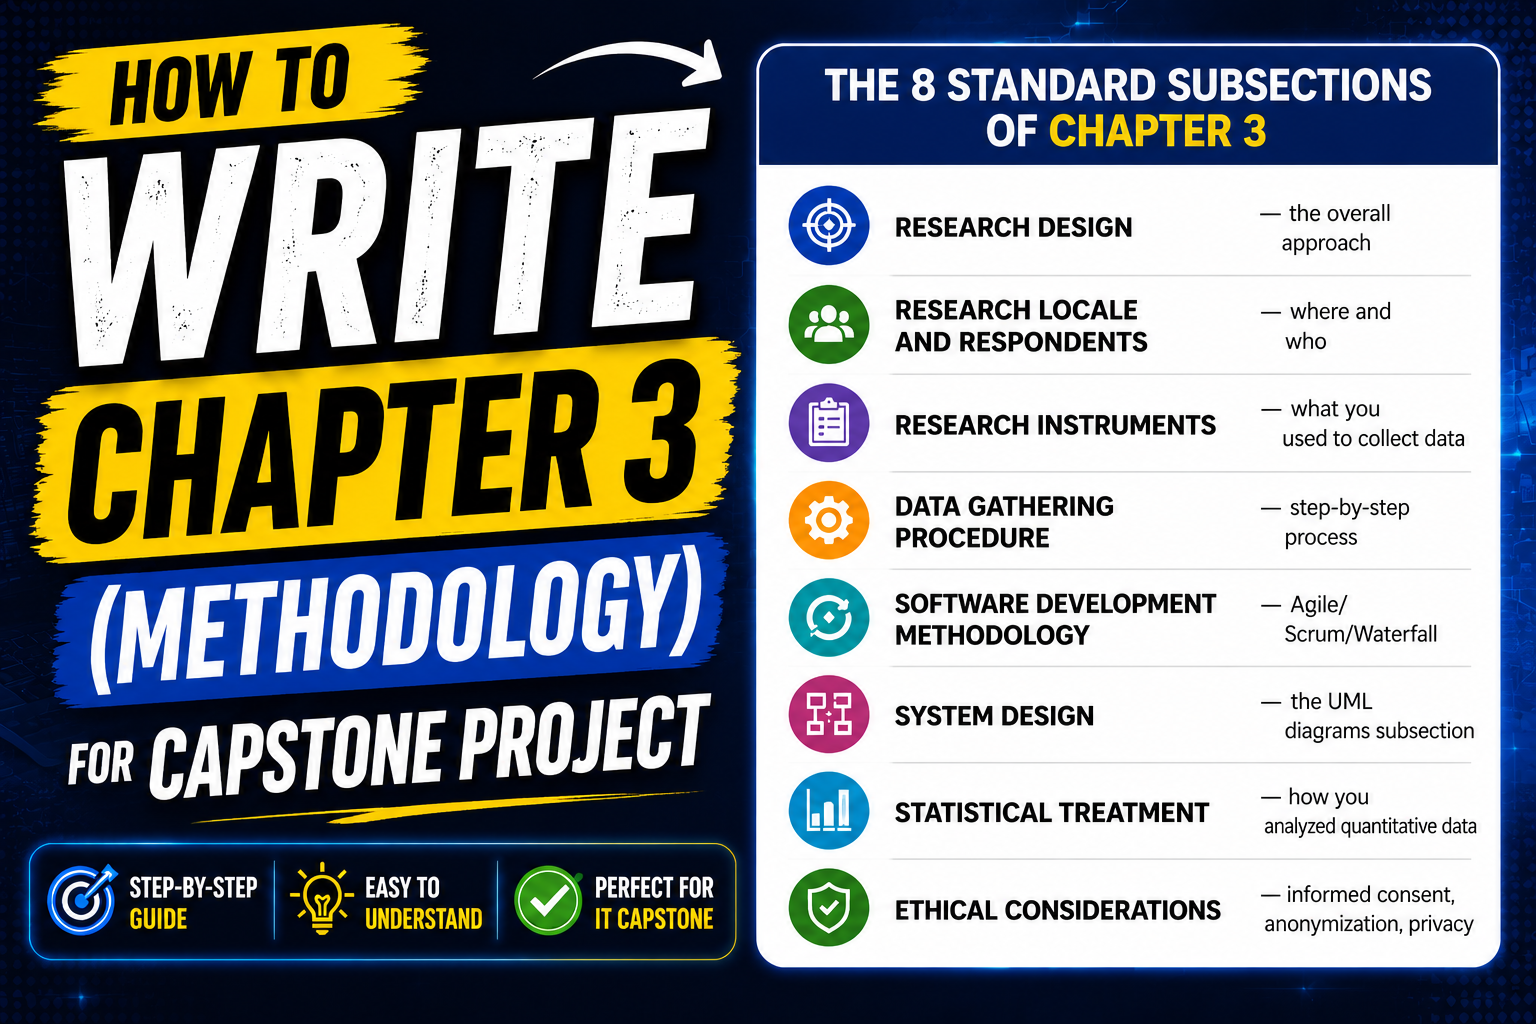
The 8 standard subsections of Chapter 3
Most BSIT and IT schools require these subsections, in this order:
- 3.1 Research Design: the overall approach
- 3.2 Research Locale and Respondents: where and who
- 3.3 Research Instruments: what you used to collect data
- 3.4 Data Gathering Procedure: step-by-step process
- 3.5 Software Development Methodology: Agile/Scrum/Waterfall
- 3.6 System Design: the UML diagrams subsection
- 3.7 Statistical Treatment: how you analyzed quantitative data
- 3.8 Ethical Considerations: informed consent, anonymization, privacy
Some schools combine 3.7 into Chapter 4 or split 3.6 across two subsections. Check your school’s manual. The substance below works for all variants.
3.1 Research Design
Four research designs are common in BSIT capstones:
Descriptive-developmental: most common. You describe the current state of the problem AND develop a system to address it. Best fit for “we built a system” projects.
Quantitative descriptive: survey-based. You measure the prevalence of something. Best fit for “we measured what users think” projects.
Mixed methods: quantitative + qualitative. You measure numbers AND collect interviews. Best fit for thesis-grade projects with strong evaluation components.
Action research: iterative implementation in a real context. You deploy, observe, adjust, redeploy. Best fit for projects with a long-term institutional partner.
For most BSIT capstones, descriptive-developmental is the right answer.
Template paragraph for descriptive-developmental:
This study employed a descriptive-developmental research design. The descriptive component documented the current state of [PROBLEM AREA] through literature review, interviews with [STAKEHOLDER GROUP], and analysis of existing systems.
Moreover, the developmental component involved the iterative design, development, and evaluation of the proposed [SYSTEM NAME] following an Agile Scrum methodology. The two components informed each other throughout the study: findings from the descriptive phase guided system feature decisions, and observations from system deployment informed the final analysis.
One paragraph. Names the design. Explains both components. Connects them.
3.2 Research Locale and Respondents
Locale = where you conducted the study. Respondents = who participated.
What to include:
- City, school, or organization where you ran the study
- Date range (start to end of data collection)
- Total number of respondents
- Sampling technique (purposive, convenience, random, stratified)
- Inclusion criteria (who qualified to participate)
Template paragraph:
The study was conducted at [SCHOOL/INSTITUTION NAME] in [CITY], [PROVINCE], from [START DATE] to [END DATE]. The respondents consisted of [N] [USER GROUP DESCRIPTION] selected through purposive sampling. To qualify as respondents, participants had to meet the following inclusion criteria: (1) [CRITERION 1], (2) [CRITERION 2], and (3) [CRITERION 3].
Example with real values for an AI tutoring capstone:
The study was conducted at Negros Occidental State University in Binalbagan, Negros Occidental, from August 1, 2026 to October 30, 2026. The respondents consisted of 32 senior high school students enrolled in Grade 12 STEM track, selected through purposive sampling. And, to qualify as respondents, participants had to meet the following inclusion criteria: (1) currently enrolled in advanced math subjects, (2) had access to a smartphone for testing, and (3) provided signed parental consent.
Be specific. “Students in the area” isn’t enough. “32 Grade 12 STEM students at Negros Occidental State University with signed parental consent” is.
3.3 Research Instruments
What you used to collect data. Most BSIT capstones use 3 to 4 instruments.
Common instruments:
- Pre-implementation survey: measures the baseline state of the problem before your system exists
- User Acceptance Testing (UAT) form: measures user response to your built system
- System logs: automated data collection from your deployed system
- Semi-structured interviews: qualitative data collection for mixed-methods studies
ISO 25010 framework for UAT: most BSIT schools use this as the basis for User Acceptance Testing. The framework evaluates software across 8 quality characteristics:
- Functional Suitability: does the system do what it’s supposed to?
- Performance Efficiency: is it fast and resource-efficient?
- Compatibility: does it work with other systems?
- Usability: is it easy to learn and use?
- Reliability: does it work consistently without crashes?
- Security: is data protected?
- Maintainability: can it be modified and extended?
- Portability: does it work across environments?
Most BSIT capstones evaluate 4 to 6 of these, not all 8. Pick the ones relevant to your system.
Template paragraph:
The researchers used the following instruments to gather data:
- Pre-implementation survey: a 15-item Likert-scale questionnaire designed to identify the baseline challenges of [USER GROUP] in [PROBLEM AREA]. The instrument was content-validated by [N] experts in [FIELD].
- User Acceptance Testing (UAT) form: adapted from the ISO 25010 software quality standard, measuring [QUALITY DIMENSIONS]. The UAT used a 5-point Likert scale ranging from Strongly Disagree (1) to Strongly Agree (5).
- System logs: automated logs of user interactions captured by the deployed system, providing quantitative data on usage patterns, feature engagement, and error frequency.
Attach the actual instruments as appendices in your back matter. Don’t just describe them.
3.4 Data Gathering Procedure
Step-by-step numbered list. The reader should be able to follow it like a recipe.
Template:
Data was gathered through the following procedure:
- Permission was secured from the [SCHOOL/INSTITUTION] administration through a formal letter.
- Respondents were briefed on the purpose of the study and the voluntary nature of their participation.
- Informed consent forms (and parental consent forms for minors) were distributed and collected before any data was gathered.
- The pre-implementation survey was administered to all respondents using [METHOD: printed forms, Google Forms, etc.].
- The developed system was deployed for a [N-week] trial period during which respondents had free access for testing.
- At the end of the trial, the UAT was administered to all respondents who completed the trial.
- System logs were exported and analyzed for usage patterns.
- All collected data was tabulated, anonymized, and prepared for statistical treatment.
Six to ten steps is typical. Fewer than five looks incomplete. More than fifteen suggests you’re padding.
3.5 Software Development Methodology
The most common choice in BSIT capstones is Agile Scrum. Document the structure even if your actual development was less formal than a real Scrum team. Your panel wants to see you followed some methodology.
Standard Agile Scrum components to document:
- Sprint structure: typically 2-week sprints
- Number of sprints: typically 4 to 8 for a 4-6 month capstone
- Daily standup: 15-minute team check-in
- Sprint review: demo to your adviser
- Sprint retrospective: team reflection
- Product backlog: your prioritized feature list
Template paragraph (Agile Scrum):
The system was developed using the Agile Scrum methodology, organized into 6 sprints of 2 weeks each across a 12-week development phase. Each sprint included the following ceremonies:
- Sprint planning (1 hour): feature selection from the product backlog based on priority and feasibility
- Daily standup (15 minutes): three-question team check-in: what was done yesterday, what will be done today, what blockers exist
- Development phase (8 working days): coding, unit testing, and integration testing of selected features
- Sprint review (1 hour): feature demonstration to the adviser for feedback
- Sprint retrospective (30 minutes): team reflection on process improvements
The product backlog was maintained as a shared spreadsheet ranked by priority. Figure 3.1 shows the Gantt chart of the development phases, included as Appendix B.
Alternative methodologies:
- Waterfall: acceptable for projects with fixed, well-understood requirements
- Iterative/Spiral: for risk-driven development
- RAD (Rapid Application Development): for projects with strong prototyping needs
- DevOps: for thesis-grade work with continuous deployment
Don’t pick three methodologies. Pick one. Use it consistently.
Attach your Gantt chart as Appendix B. Panels look for it.
3.6 System Design: the UML diagrams subsection
The most important subsection of Chapter 3. This is where every required UML diagram lives.
Required UML diagrams in most BSIT capstones:
- Use Case Diagram: shows actors and what they can do with the system. See our Use Case Diagram guide.
- Data Flow Diagram: Level 0 (context diagram) and Level 1 (decomposition). See our DFD guide with worked example: DFD for Library Management System.
- Entity Relationship Diagram: your database design. See our ER Diagram guide.
- Class Diagram: for object-oriented projects. See our Class Diagram guide.
- Activity Diagram: for processes with branches and loops. See our Activity Diagram guide.
- Sequence Diagram: for specific workflows. See our Sequence Diagram guide.
Optional but impressive for thesis-grade work:
- State Diagram (for systems with multiple states)
- Component Diagram (for systems with multiple integrated parts)
- Deployment Diagram (for projects with cloud or distributed architecture)
How to embed each diagram in your document:
Every diagram needs three elements:
- A Figure number: Figure 3.1, Figure 3.2, etc. Number sequentially within the chapter.
- A Caption: Below the diagram. Format: “Figure 3.1. Use Case Diagram of the [System Name].”
- A Paragraph explaining it: In the body text, ABOVE the diagram. Two to three sentences naming the actors, the main use cases, and any non-obvious relationships.
Example explanation paragraph for a Use Case Diagram:
Figure 3.1 presents the Use Case Diagram of the proposed system. Two primary actors interact with the system: the Student (who searches for resources, takes assessments, and views progress reports) and the Teacher (who manages content, reviews student performance, and exports reports).
The administrator role inherits all teacher use cases and additionally manages user accounts. The system also interacts with one external system: the school’s existing Learning Management System for student authentication.
Create the diagrams in draw.io (free), Lucidchart (free tier), or PlantUML (text-based, easy version control). Export as PNG at 150-300 DPI for print quality.
Do not draw UML diagrams in PowerPoint or Word’s built-in shapes. Panels can tell, and the inconsistent formatting hurts your defense.
3.7 Statistical Treatment
For quantitative data collected through UAT or surveys.
Common statistical methods in BSIT capstones:
- Weighted mean: most common, used for Likert scale UAT
- Frequency and percentage: for categorical data
- Standard deviation: alongside mean for thesis-grade rigor
- Pearson correlation: if you’re testing relationships between variables
- t-test: if you’re comparing two groups (pre vs post)
Standard 5-point Likert scale interpretation table:
| Weighted Mean Range | Verbal Interpretation | Acceptability Level |
|---|---|---|
| 4.50 – 5.00 | Strongly Agree | Highly Acceptable |
| 3.50 – 4.49 | Agree | Acceptable |
| 2.50 – 3.49 | Neutral | Moderately Acceptable |
| 1.50 – 2.49 | Disagree | Less Acceptable |
| 1.00 – 1.49 | Strongly Disagree | Not Acceptable |
Template paragraph:
Quantitative data from the UAT was analyzed using weighted mean and standard deviation. The Likert scale responses were interpreted using the following ranges:
[insert the table above]
Frequency and percentage distribution were used to summarize demographic information of respondents. All statistical computations were performed using Microsoft Excel 2024 with the Data Analysis ToolPak add-in.
Whatever statistical methods you list here MUST appear in Chapter 4. If you write “we used standard deviation” here but only show means in Chapter 4, the panel will catch it.
3.8 Ethical Considerations
The section most students skip. Don’t be that student.
Five must-have ethical commitments:
- Informed consent: every respondent agreed in writing to participate
- Withdrawal rights: respondents could leave the study at any time without penalty
- Data anonymization: no individual identifiers in published results
- Data Privacy Act compliance: RA 10173 in the Philippines, or your country’s equivalent
- No deception: respondents were told the true purpose of the study
Template paragraph:
The researchers observed the following ethical considerations throughout the study:
Informed Consent. All respondents received a written explanation of the study’s purpose, procedures, and expected duration before agreeing to participate. Signed consent forms were collected from all adult respondents; parental consent was obtained for any participants under 18 years of age.
Voluntary Participation. Respondents were informed that participation was completely voluntary and that they could withdraw from the study at any time without penalty or consequence. No respondent withdrew during the data collection period.
Data Privacy. All collected data was anonymized prior to analysis. Personal identifiers were removed and replaced with respondent codes. The study complies with the Data Privacy Act of 2012 (Republic Act No. 10173) regarding the collection, processing, and storage of personal information.
No Deception. The researchers disclosed all aspects of the study to respondents truthfully, including the technology being evaluated and the data being collected.
Data Storage. Raw data is stored on a password-protected device accessible only to the research team and will be securely deleted one year after the conclusion of the study.
For studies involving medical data, financial data, or vulnerable populations (children, elderly, hospital patients), add a paragraph about IRB review if your school has one. If not, mention that the study was reviewed and approved by your capstone adviser and your school’s research coordinator.
Common mistakes that get Chapter 3 sent back
Eight patterns that consistently kill Chapter 3 reviews:
- Research design doesn’t match what was actually done. If you wrote “experimental design” but didn’t have a control group, the panel will catch it.
- Vague respondent description. “Students” is not enough. “32 Grade 12 STEM students at NOSU Binalbagan” is.
- Instruments described but not attached as appendices. If you mention a UAT form, the actual form must be in your appendices.
- Sprint methodology described but no Gantt chart. Agile Scrum without a Gantt chart is incomplete. Attach it as Appendix B.
- UML diagrams missing or unexplained. Every diagram needs an explanation paragraph. Diagrams without text are wallpaper.
- Statistical treatment chosen but not applied in Chapter 4. If you write “Pearson correlation” here, Chapter 4 must include actual correlations.
- No ethics section. This is the easiest section to write and the easiest to skip. Don’t skip it.
- Sample size too small or unjustified. Below 10 respondents looks insufficient. Justify your number (“limited by the population of the target user group”).
Quick reference: Chapter 3 readiness checklist
Use this before submitting to your adviser:
- [ ] Research design stated in one sentence with justification
- [ ] Locale and date range specified (city, school, start date, end date)
- [ ] Respondent count and selection criteria documented
- [ ] All instruments listed in 3.3 and attached as appendices
- [ ] Data gathering steps numbered and complete
- [ ] Sprint methodology with sprint count and duration
- [ ] All required UML diagrams embedded with explanation paragraphs
- [ ] Statistical treatment matches what appears in Chapter 4
- [ ] Ethics paragraph references the Data Privacy Act of 2012
- [ ] Gantt chart attached as Appendix B
- [ ] All diagrams use consistent formatting (same UML tool throughout)
If you can check all 11 items, Chapter 3 is ready for your adviser’s review.
How long should Chapter 3 be
Most BSIT capstones have Chapter 3 between 10 and 15 pages. Roughly:
- 3.1 Research Design: 1 page
- 3.2 Locale and Respondents: 1 to 2 pages
- 3.3 Research Instruments: 2 pages
- 3.4 Data Gathering Procedure: 1 page
- 3.5 Software Development Methodology: 1 to 2 pages
- 3.6 System Design (UML diagrams): 3 to 5 pages (the largest subsection)
- 3.7 Statistical Treatment: 1 page
- 3.8 Ethical Considerations: 1 page
If your Chapter 3 is under 8 pages, you probably skipped a subsection. If it’s over 20 pages, you’re likely padding or including content that belongs in Chapter 4.
Official references
Frequently Asked Questions
How long should Chapter 3 of a capstone be?
What is the best research design for an IT capstone?
Do I need to use Agile for my capstone methodology?
What UML diagrams should I include in Chapter 3?
How do I write the statistical treatment section?
Now open draw.io. Sketch your use case diagram. Start Chapter 3.
Chapter 3 doesn’t get written all at once. It gets built incrementally as you build the system. The research design and locale are written before development starts. The instruments are designed during development.
Moreover, the UML diagrams are drawn as you architect the system. The statistical treatment is decided when you plan the UAT.
If you wait until everything is done before opening Chapter 3, you’ll forget half the details and have to reconstruct them from memory.
For the full 5-chapter context, see our Capstone Chapter 1-5 Template. For Chapter 2 RRL writing help, see our Chapter 2 RRL guide with examples. Every UML diagram you’ll need for 3.6 is covered in our UML guides with worked examples.
If you haven’t picked your capstone topic yet, browse 150 Best Capstone Project Ideas for IT Students 2026. For source code examples to reference when justifying technical choices, see our Python projects library and free projects library for other stacks.
Open draw.io. Sketch your Use Case Diagram. That’s where Chapter 3 actually starts.

Caren Bautista
Technical Writer at PIES IT Solution
Responsible for crafting clear, well-structured, and beginner-friendly content across the platform. Handles the writing, proofreading, and editorial review of tutorials, guides, and documentation to ensure every article is accurate, readable, and easy to follow.
Expertise: Technical Writing · Content Creation · Documentation · Editorial Writing · JavaScript · TypeScript · Python · Python Errors · HTTP Errors · MS Excel · View all posts by Caren Bautista →