
If your BSIT or BSCS capstone is an E-commerce Website, the Data Flow Diagram is the diagram your panel will probe hardest. It’s the one that proves you understand how data actually moves, from browsing the catalog to placing an order to processing payment and shipping, rather than just that you can build product list pages.
This guide walks through all three DFD levels (0, 1, and 2) for a complete e-commerce website, with worked examples you can drop straight into Chapter 3 Section 3.6 of your capstone documentation. By the end, you will have a defensible DFD set and the explanation paragraphs to go with each figure.
Last updated: June 2026, written by PIES Information Technology Solutions, drawn from 10+ years of guiding BSIT capstones through panel reviews.
📌 Quick answer: A Data Flow Diagram (DFD) for an E-commerce Website shows how data moves between buyers, sellers, administrators, payment gateways, and the shipping provider. Level 0 is the context diagram, one bubble for the entire system with all external entities. Level 1 decomposes into 6-7 main processes (Register/Login, Browse Products, Manage Cart, Checkout, Process Payment, Manage Orders, Manage Inventory, Reports). Level 2 drills into the most complex process, usually Checkout or Process Payment. Use Yourdon notation (circles for processes) for Filipino BSIT capstones unless your school specifies Gane-Sarson.
What is a Data Flow Diagram?
A Data Flow Diagram (DFD) is a graphical representation of how data moves through a system. Emphasis on data, DFDs are not flowcharts. They do not show control flow, loops, or decision branches. They show what data enters the system, who sends it, what process transforms it, where it gets stored, and where it eventually leaves.
DFDs live in Chapter 3, Section 3.6 (System Design) of standard BSIT and BSCS capstone documentation, alongside your UML diagrams. Most Philippine universities require at least Level 0 and Level 1; stronger documentation packages also include Level 2 for one or two of the more complex processes.
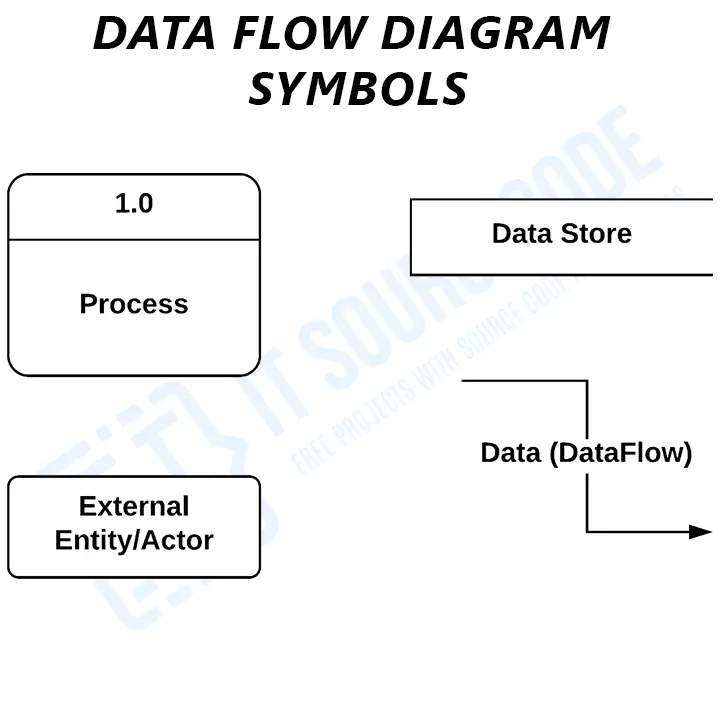
Every DFD is built from just four elements:
- External Entity (rectangle), anyone or anything outside the system that sends or receives data. For an e-commerce website: Customer, Seller, Administrator, Payment Gateway, Shipping Provider.
- Process (circle in Yourdon notation, rounded rectangle in Gane-Sarson), work done on data. Inputs become outputs. Numbered 1.0, 2.0, 3.0 at Level 1; 4.1, 4.2, 4.3 at Level 2.
- Data Store (two parallel lines or open-ended rectangle), where data is held. In code terms, a database table or file. Labeled D1, D2, D3.
- Data Flow (labeled arrow), the data itself moving between elements. Every arrow must be labeled. “Order Placed,” “Payment Authorization,” “Shipping Confirmation”, never just “data” or “info.”
Four rules govern how these elements connect: a process must transform data (input and output required), a data store cannot send data directly to an external entity, an external entity cannot send data directly to a data store, and every data flow must be labeled. Break any of these and your panel will catch it within the first slide.
E-commerce Website: Scope Overview
Before drawing the DFD, lock down the scope. A typical BSIT e-commerce capstone covers seven functional modules:
- User Registration & Login: Sign up new customers (and optionally sellers), verify email, manage profiles, password reset, session/login.
- Product Catalog & Browsing: List products by category, search, filter by price/brand, view product detail page with images and reviews.
- Shopping Cart Management: Add to cart, update quantities, remove items, save for later, persist cart across sessions.
- Checkout: Capture shipping address, choose shipping method, compute totals (subtotal + shipping + tax), select payment method.
- Payment Processing: Hand off to payment gateway (PayMongo, GCash, Stripe, PayPal), receive authorization, record transaction, mark order as paid.
- Order Management: Confirm orders, update status (placed → packed → shipped → delivered), handle cancellations and refunds, generate invoices.
- Inventory Management & Reports: Sellers and admins update stock, low-stock alerts, sales reports, top-product reports, revenue dashboards.
For this guide we model these modules with five external entities (Customer, Seller, Administrator, Payment Gateway, Shipping Provider) and five data stores (Users, Products, Cart, Orders, Payments). This is the typical scope for a 12-16 week BSIT capstone. If your project is bigger, multi-vendor marketplace, mobile app, recommendation engine, add 1-2 more processes and 1-2 more data stores per extension.
If you are still comparing capstone topics, see our 150 Best Capstone Project Ideas for IT Students (2026) for project options, or browse the PHP project source code library to study a working e-commerce system before drawing your DFD.
DFD Level 0: Context Diagram
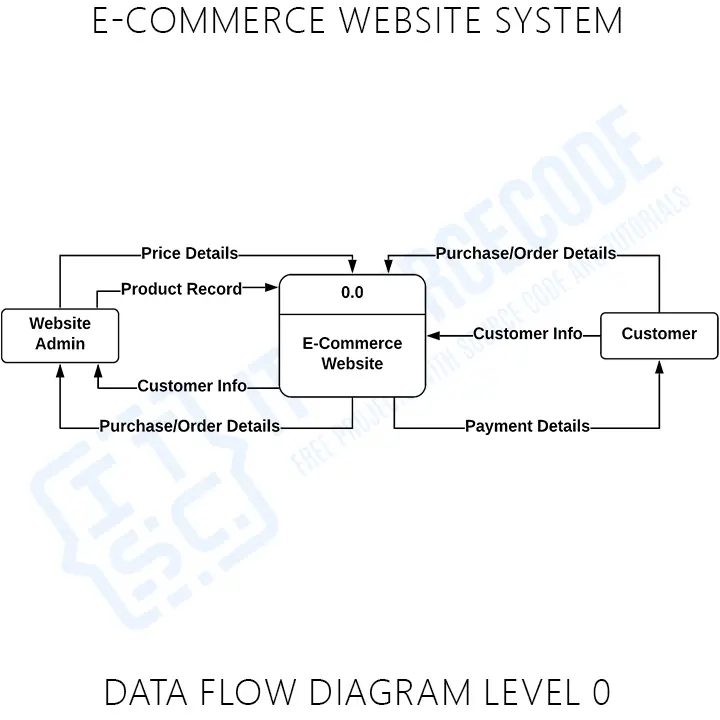
Level 0, also called the Context Diagram, shows the entire system as a single process bubble. No internal detail, no data stores, no subprocesses, just the system, all the external entities, and the major data flows in and out.
The purpose of Level 0 is to define the system boundary: what is inside (your responsibility to build) and what is outside (external actors and third-party services you will interact with).
Level 0: E-commerce Website
                Registration / Order ─────────►
   [Customer] ◄──── Confirmation / Invoice ────┐
                Search / Cart Actions ─────────►│
                                                ▼
                       ┌──────────────────────────────────┐
   [Seller] ──Product/Stock──►                            │
            ◄─Sales Report──  │   0  E-commerce Website   │
                              │                            │
   [Admin]  ──Manage Users──► │                            │
            ◄─System Reports── │                           │
                              └──────────────────────────────┘
                                       ▲              ▲
              Payment Request ─────────┘              └───── Shipment Request
              Payment Response                                Tracking Update
                                       ▼              ▼
                            [Payment Gateway]   [Shipping Provider]
What’s in Level 0: one process bubble (numbered 0 or unnumbered), all five external entities, and labeled data flows between each entity and the system. No data stores at Level 0, those only appear from Level 1 onwards.
Caption: Figure 3.1. Level 0 Data Flow Diagram of the E-commerce Website.
Explanation paragraph (for Chapter 3): Figure 3.1 presents the Level 0 (Context) Data Flow Diagram of the proposed E-commerce Website. Five external entities interact with the system: Customers (who register, browse, place orders, and receive confirmations and invoices), Sellers (who upload product data and receive sales reports), Administrators (who manage users and system settings and receive system-wide reports), the Payment Gateway (a third-party service such as PayMongo, GCash, or PayPal that authorizes and captures payments), and the Shipping Provider (a third-party courier that accepts shipment requests and returns tracking updates). The Level 0 diagram establishes the system boundary and the major data exchanges with each external entity, without exposing internal processes or data stores.
DFD Level 1: Main Processes
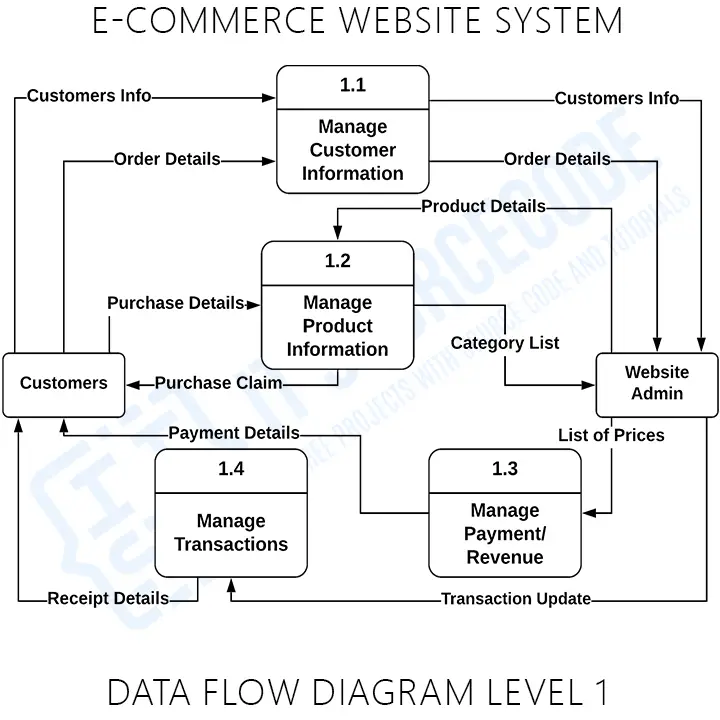
Level 1 decomposes the single Level 0 bubble into the main processes of the system. This is where data stores first appear. For our e-commerce website, Level 1 shows seven processes, five data stores, and all labeled data flows between processes, entities, and stores.
Level 1: Process map
[Customer] ──Sign-up / Login──► (1.0 Register & Login) ──User Record──► D1 Users
                                                        └─Session / Welcome──► [Customer]

[Seller] ──Product Data──► (2.0 Product Catalog) ──Product Record──► D2 Products
                                                  └─Confirmation──► [Seller]

[Customer] ──Search / Browse──► (3.0 Browse Products) ──Read──► D2 Products
                                                       └─Listings──► [Customer]

[Customer] ──Add / Update Cart──► (4.0 Manage Cart) ──Cart Item──► D3 Cart
                                                     └─Cart Total──► [Customer]

[Customer] ──Checkout Request──► (5.0 Checkout & Payment) ──Order──► D4 Orders
                                                          ├─Read──► D3 Cart
                                                          ├─Payment Request──► [Payment Gateway]
                                                          ├─Payment Response──► (writes) D5 Payments
                                                          └─Order Confirmation──► [Customer]

D4 Orders ──Order Ready──► (6.0 Manage Orders) ──Shipment Request──► [Shipping Provider]
                                                ├─Tracking Update──◄── [Shipping Provider]
                                                ├─Update Status──► D4 Orders
                                                ├─Update Stock──► D2 Products
                                                └─Status Notification──► [Customer]

[Admin] ──Report Request──► (7.0 Reports & Admin) ──Stats──► [Admin]
                                                  ├─Read──► D1 Users
                                                  ├─Read──► D2 Products
                                                  ├─Read──► D4 Orders
                                                  └─Read──► D5 Payments
What’s in Level 1: seven process bubbles (1.0 through 7.0), all five external entities from Level 0, five data stores (D1 Users, D2 Products, D3 Cart, D4 Orders, D5 Payments), and every data flow labeled.
Process explanations
1.0 Register & Login: Accepts customer sign-ups, validates email and password rules, hashes the password, writes the user record to D1 Users, and issues a session token on successful login. Also handles seller onboarding if the system is multi-vendor.
2.0 Product Catalog: Accepts product data from the seller (title, description, SKU, price, stock, images, category), writes the catalog entry to D2 Products, and returns a confirmation. Handles updates, deletions, and stock adjustments for existing entries.
3.0 Browse Products: Reads from D2 Products to serve search results, category listings, and product detail pages to the customer. Read-only, does not write to any data store except perhaps a “recently viewed” cache.
4.0 Manage Cart: Accepts add-to-cart, update-quantity, and remove-item actions. Writes to D3 Cart keyed by user ID (or session ID for guests). Returns the running cart total back to the customer. May validate against D2 Products for stock availability.
5.0 Checkout & Payment: The most complex process. Reads the cart from D3, captures shipping and billing address, calls the Payment Gateway with the order total, records the payment response in D5 Payments, writes the confirmed order to D4 Orders, clears the cart, and returns an order confirmation to the customer. Decomposed in Level 2 below.
6.0 Manage Orders: Handles the post-payment lifecycle. Sends shipment requests to the Shipping Provider, receives tracking updates, updates order status in D4 Orders (placed → packed → shipped → delivered), decrements stock in D2 Products, and notifies the customer of each status change.
7.0 Reports & Admin: Responds to administrator queries by reading from D1 Users, D2 Products, D4 Orders, and D5 Payments, producing reports on revenue, top products, customer activity, low-stock alerts, and refund history.
Caption: Figure 3.2. Level 1 Data Flow Diagram of the E-commerce Website.
DFD Level 2: Subprocess Decomposition
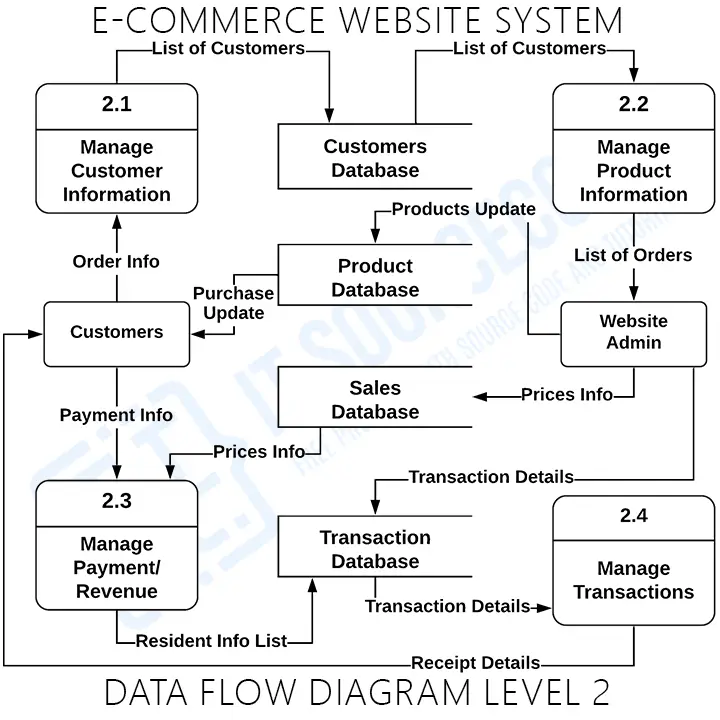
Level 2 takes one Level 1 process and decomposes it into its subprocesses. You do not need a Level 2 diagram for every Level 1 process, only the complex ones that benefit from showing internal structure. For an e-commerce website, the obvious candidate is Process 5.0 (Checkout & Payment): it has the most logic, the most validation, and the most external integration.
Level 2: Process 5.0 (Checkout & Payment)
[Customer] ──Checkout Request──► (5.1 Load Cart) ──Read──► D3 Cart
                                                  └─Cart Summary──► (5.2 Capture Address)

[Customer] ──Address & Shipping──► (5.2 Capture Address) ──Address──► (5.3 Compute Totals)

(5.3 Compute Totals) ──Subtotal + Shipping + Tax──► (5.4 Initiate Payment)

(5.4 Initiate Payment) ──Payment Request──► [Payment Gateway]
                       ◄─Authorization / Denial──── [Payment Gateway]
                       └─Payment Record──► D5 Payments

(5.4 Initiate Payment) ──Authorized──► (5.5 Create Order)
                       └──Denied──► (5.6 Cancel Checkout) ──Failure Notice──► [Customer]

(5.5 Create Order) ──Order Record──► D4 Orders
                   ├─Clear Cart──► D3 Cart
                   ├─Reserve Stock──► D2 Products
                   └─Order Confirmation──► [Customer]
What’s in Level 2: six subprocess bubbles (5.1 through 5.6), numbered as children of 5.0; the external entities and data stores that touch Process 5.0; and detailed internal data flows showing the sequence of operations.
Subprocess explanations
5.1 Load Cart: Reads the customer’s current cart from D3, validates that all items are still in stock by cross-checking D2 Products, and produces a cart summary for the checkout flow.
5.2 Capture Address: Collects shipping address, billing address, and chosen shipping method from the customer. May offer saved addresses if the user has previous orders in D4.
5.3 Compute Totals: Calculates subtotal from cart items, adds shipping cost based on the chosen method, adds applicable tax, applies any discount codes, and produces the final order total to charge.
5.4 Initiate Payment: Sends a payment request to the Payment Gateway with the total amount and order reference. Waits for the authorization or denial response, records the transaction in D5 Payments, and routes to 5.5 (on success) or 5.6 (on failure).
5.5 Create Order: Writes the confirmed order to D4 Orders with all line items, addresses, payment reference, and “placed” status. Clears the cart in D3 and reserves stock in D2. Sends an order confirmation email to the customer.
5.6 Cancel Checkout: Triggered when the Payment Gateway denies the transaction. Notifies the customer with a failure reason and a retry link. Does not clear the cart so the customer can fix the issue and try again.
Caption: Figure 3.3. Level 2 Data Flow Diagram of Process 5.0, Checkout & Payment.
DFD Notation Reference
| Element | Yourdon | Gane-Sarson | E-commerce example |
|---|---|---|---|
| External Entity | Rectangle | Rectangle with shadow | Customer, Seller, Payment Gateway |
| Process | Circle | Rounded rectangle | 5.0 Checkout & Payment |
| Data Store | Two parallel lines | Open-ended rectangle | D2 Products, D4 Orders, D5 Payments |
| Data Flow | Labeled arrow | Labeled arrow | “Order Placed,” “Payment Authorization” |
Yourdon notation (circles for processes) is the de facto standard in Filipino BSIT capstones. Gane-Sarson (rounded rectangles) is more common in business systems analysis programs. Pick one and stay consistent across all three levels of your DFD set, mixing notations is one of the fastest ways to get sent back by a panel.
Common Mistakes in E-commerce DFDs
Eight patterns we see kill the DFD section in e-commerce capstones during panel reviews:
- Treating the Payment Gateway as an internal process. PayMongo, GCash, Stripe, PayPal, all external entities. Your system requests payment from them; it does not contain them. Drawing the gateway as a process is the single fastest way to confuse the panel about where your system boundary actually is.
- Skipping the Shipping Provider entity. If your scope includes physical delivery, the courier (LBC, J&T, JRS, or any in-house dispatch) is an external entity that receives shipment requests and returns tracking updates. Don’t bury it inside the order management process.
- Black-hole checkout process. Data goes into “Process Checkout” and nothing comes out except a vague “result.” Every process needs at least one input and one output. The outputs for checkout are the confirmed order, the cleared cart, the stock reservation, and the order confirmation email.
- Customer writes directly to D4 Orders. External entities cannot write directly to a data store, they must go through a process (5.0 Checkout & Payment). Same rule for reading.
- Unlabeled flows. Every arrow needs a specific name: “Payment Request,” “Authorization Response,” “Order Confirmation.” Not “data,” not “info,” not blank.
- Level 0 with multiple bubbles. Level 0 is one bubble representing the entire system. If your context diagram has multiple bubbles, you have drawn Level 1 by mistake.
- Combining “Cart” and “Checkout” into one process. They are related but distinct, cart management is per-session item tracking, checkout is a one-shot order creation flow. Splitting them keeps each process focused (single-responsibility) and makes your Level 2 decomposition cleaner.
- Inconsistent numbering between levels. Process 5.0 in Level 1 must decompose to 5.1, 5.2, 5.3 in Level 2, not 6.1 or 1.1. The number chain shows the parent-child relationship and panels will trace it.
How to Draw This DFD in draw.io (Step-by-Step)
draw.io (now diagrams.net) is the recommended tool for BSIT capstone DFDs, it is free, browser-based, has built-in DFD shape libraries for both Yourdon and Gane-Sarson notation, and exports cleanly to PNG and PDF for your Chapter 3 documentation.
- Open draw.io at app.diagrams.net. Choose “Create New Diagram” → “Blank Diagram.” Save to Google Drive or your local device.
- Enable DFD shapes. In the left panel, click “More Shapes” at the bottom → check “Software” → check “Yourdon and Coad” (or “Gane-Sarson” if you prefer that notation) → Apply. The DFD shapes now appear in the left sidebar.
- Draw Level 0 first. Drag one circle to the center, label it “0 E-commerce Website.” Place five rectangles around it: Customer (left), Seller (upper-left), Admin (upper-right), Payment Gateway (lower-left), Shipping Provider (lower-right). Connect each entity to the system bubble with labeled arrows. Save as
dfd-level-0.drawio. - Draw Level 1. Create a new page (tab at the bottom). Place seven process circles in a logical layout, left-to-right by flow order usually works best: 1.0 Register & Login, 2.0 Product Catalog, 3.0 Browse, 4.0 Cart, 5.0 Checkout & Payment, 6.0 Manage Orders, 7.0 Reports. Add the five data stores and all five external entities. Connect with labeled flows. This page is dense, give yourself space and consider landscape orientation.
- Draw Level 2 for Process 5.0. New page. Place six subprocess circles (5.1 through 5.6). Show only the data stores and entities that touch Process 5.0 (Customer, Payment Gateway, D2 Products, D3 Cart, D4 Orders, D5 Payments). Connect with labeled flows.
- Export each level as PNG. File → Export As → PNG. Set border to 20px, transparent background off (use white). Export at 200 DPI for crisp printing in your Chapter 3 PDF.
- Insert into Chapter 3. In Word or LaTeX, insert each PNG, add a numbered caption below (Figure 3.1, 3.2, 3.3), and write the explanation paragraph above each figure. Reference each figure by number in the body text (“As shown in Figure 3.2…”).
For the surrounding Chapter 3 structure, see our Chapter 3 Methodology guide, it walks through the sections (3.1 Research Design, 3.5 System Architecture) that your DFD set fits into.
Defense Tips for Your Capstone Presentation
🎓 Five things your panel will ask about your e-commerce DFD
- “Why is the Payment Gateway external?” Because you don’t control it. You don’t store card numbers (PCI compliance), you don’t authorize transactions, you just request and receive a response. Be ready to name the gateway you would actually use, PayMongo and GCash for Philippine deployments, Stripe or PayPal for international.
- “What happens if the payment fails halfway?” Walk them through Process 5.6 (Cancel Checkout). The cart is preserved, the order is not created in D4, no stock is reserved, the customer gets a clear failure reason. Idempotency matters.
- “Where does inventory get decremented?” Be clear it’s at order creation (Process 5.5), not at cart-add. Otherwise customers could lock up stock just by browsing.
- “How would this scale to multi-vendor?” Add Seller as a writer to D2 Products (already shown), introduce a “Seller Wallet” data store for payouts, and split Process 7.0 Reports between admin-wide and per-seller views.
- “Why no caching layer in the DFD?” DFDs model logical data flow, not physical infrastructure. Redis, CDN, browser cache, none of those belong in a DFD. They belong in your System Architecture diagram (Section 3.5).
Featured guides worth reading next
Official documentation
Working source code for this system
Download the actual implementation of this system in your preferred language. Each project includes source code, database, and setup instructions for BSIT capstone use.
Get the ready-to-defend package: complete PHP + MySQL source code, full Chapter 1-5 documentation, 6 UML diagrams, ERD, installation guide, user manual, and defense presentation template. Save 3 to 4 weeks of capstone work.
Sold via Gumroad. See our affiliate disclosure.
Working e-commerce source code that implements this DFD
The DFD above defines the data flows; these are the actual e-commerce projects on itsourcecode.com that implement those flows. Pick one in your team’s stack and you have a working reference to point your panel at when they ask “show me where the customer data actually moves through the system.”

PHP: E-commerce Website in PHP
Vanilla PHP + MySQL backend. Maps directly to the data flows shown in the diagrams above.

Laravel: Complete Laravel E-commerce
Laravel 10 + Tailwind. Multi-vendor support, MVC matches your DFD process boundaries.

CodeIgniter: Complete E-commerce in CodeIgniter
CI4 + Bootstrap. MVC structure mirrors the Level 1 process decomposition.
ASP.NET: E-commerce Website in ASP.NET
ASP.NET MVC + SQL Server. Classic capstone-ready stack for Microsoft-track schools.
Django (Python): Django E-commerce
Django 4 + Bootstrap. Class-based views map cleanly to the entities in your DFD.

Python (Flask): Online Shopping in Python
Python + Flask + SQLite. Lightweight option for beginners and demo systems.

JavaScript / Vue: Vue.js + Firebase Shopping Cart
Vue 3 + Firebase realtime DB. Modern SPA, good for “what if data store is cloud” defense.

Node + Express + MongoDB. Full-stack JavaScript. Pairs with MongoDB-style data stores in DFD.
How to use this for your Chapter 3: download one of the projects, then map each data flow in your DFD (Level 0/1/2) to a specific module/controller in the downloaded source. That mapping IS the bridge between your design and your implementation chapters.
Frequently Asked Questions
What is a DFD for an E-commerce Website?
What are the external entities in an E-commerce Website DFD?
How many processes should be in Level 1 of an E-commerce DFD?
What data stores should I include in an E-commerce DFD?
Which process should I decompose in Level 2 for an e-commerce website?
What is the difference between Level 0, Level 1, and Level 2 DFDs?
Is the Payment Gateway part of the e-commerce system?
What tool should I use to draw the E-commerce DFD?
Can a customer write directly to the orders table in a DFD?
Where do DFDs go in e-commerce capstone documentation?
📌 Need the full e-commerce capstone, not just the DFD?
Grab a working PHP e-commerce source code to study before drawing your own diagrams, browse the matching DFD for Library Management System for a similar walkthrough, see all DFD examples in the library, or pick a topic from 150 Best Capstone Project Ideas for IT Students (2026).
Final Recommendation
If you take only one habit from this guide, make it this: sketch all three DFD levels on paper before opening draw.io. Most students who get sent back by their panel did not think through the data flow, they jumped straight into a diagramming tool and ended up with arrows that don’t quite tell a coherent story. Five minutes on paper saves an hour of re-drawing.
Lock down your scope first (seven processes, five data stores, five external entities is the standard e-commerce shape). Draw Level 0 today. Draw Level 1 by the end of the week. Draw Level 2 for Process 5.0 (Checkout & Payment) by next Monday. By then you will understand your system better than 90% of the teams who skipped this exercise, and your Chapter 3 will pass the panel review on diagram structure alone.
- Sketch Level 0 on paper, one bubble, five external entities, labeled flows
- Sketch Level 1, seven processes, five data stores, all flows labeled
- Sketch Level 2 for Process 5.0 (Checkout & Payment), six subprocesses including the failure path
- Redraw all three in draw.io using Yourdon notation
- Compare with the Library Management DFD to sanity-check your structure
- Browse more DFD examples, the full UML library, or pick a topic from 150 Capstone Ideas 2026
Stuck on a specific level or process flow, especially the payment integration? Drop a comment with your scope (single-vendor or multi-vendor, which payment gateway, physical or digital products) and we will help you map out the diagram.

Mary Grace G. Patulada
Programmer & Technical Writer at PIES IT Solution
Mary Grace G. Patulada (pen name ‘Nym’) is a programmer and writer at PIES IT Solution with a BSIT background from Carlos Hilado Memorial State College, Binalbagan Campus. Authored 370+ UML diagram tutorials and capstone documentation guides at itsourcecode.com. Specializes in UML (class, use case, activity, sequence, component, deployment), DFD, and ER diagrams for BSIT capstone projects.
Expertise: UML Diagrams · DFD · ER Diagrams · Use Case Diagrams · Activity Diagrams · Capstone Documentation · PHP
· View all posts by Mary Grace G. Patulada →