
Are you a BSIT student working on a Library Management System for your capstone? Then your panel will surely focus on your Data Flow Diagram during the defense. The DFD is the diagram that proves you truly understand how data moves through your system. From member registration, to book borrowing, then to fine collection. Not just CRUD forms.
Last updated: July 27, 2026. Verified working with current app versions.
In this guide, I will walk you through all three DFD levels (0, 1, and 2) for a complete Library Management System. The worked examples here you can drop straight into Chapter 3 Section 3.6 of your capstone documentation. By the end of this guide, you will have a defensible DFD set, plus the explanation paragraphs to pair with each figure.
By the way, I also have here some related materials. We have PHP Projects with Source Code, our 150 Capstone Project Ideas for IT Students 2026, the Chapter 2 Thesis Writing guide, and the Chapter 3 Methodology template. After finishing your DFD, you might need a Sample project with source code to study before coding starts.
Last updated: June 2026, written by PIES Information Technology Solutions, drawn from 10+ years of guiding BSIT capstones through panel reviews.
Quick answer
A Data Flow Diagram (DFD) for a Library Management System shows how data moves between members, librarians, the catalog, borrowing records, and fine logs. Level 0 is the context diagram. One bubble, the whole system, all external entities. Level 1 decomposes into 5 to 6 main processes (Member Registration, Book Cataloging, Borrowing and Returning, Reservation, Fine Management, Reports). Level 2 drills into the most complex process. For Library Systems, this is usually the Borrowing and Returning process. Use Yourdon notation (circles for processes) for BSIT capstones, unless your school specifies Gane-Sarson.
What is a Data Flow Diagram?
A Data Flow Diagram (DFD) is a graphical representation of how data moves through your system. Take note of the emphasis on data. DFDs are not flowcharts. They don’t show control flow, loops, or decision branches. What they show is what data enters the system, who sends it, what process transforms it, where it gets stored, and where it eventually leaves.
DFDs live in Chapter 3, Section 3.6 (System Design) of standard BSIT capstone documentation, alongside your UML diagrams. Most Philippine universities require at least Level 0 and Level 1. The stronger documentation packages also include Level 2 for one or two of the more complex processes.
Every DFD is built from just four elements:
- External Entity (rectangle). Anyone or anything outside the system that sends or receives data. For a library, these are Member, Librarian, and Administrator.
- Process (circle in Yourdon notation, rounded rectangle in Gane-Sarson). Work done on data. Inputs become outputs. Numbered 1.0, 2.0, 3.0 at Level 1, then 2.1, 2.2, 2.3 at Level 2.
- Data Store (two parallel lines or open-ended rectangle). Where data is held. In code terms, this is a database table or file. Labeled D1, D2, D3.
- Data Flow (labeled arrow). The data itself moving between elements. Every arrow must be labeled with a clear name like “Sale Entry,” “Book Issued,” or “Fine Notice.” Never just “data” or “info.”
Four rules govern how these elements connect. First, a process must transform data (input and output required). Second, a data store cannot send data directly to an external entity. Third, an external entity cannot send data directly to a data store. Finally, every data flow must be labeled. Break any of these rules and your panel will surely catch it during the defense.
Library Management System Overview
Before drawing the DFD, lock down the scope first. A typical BSIT Library Management System capstone covers six functional modules:
- Member Registration and Management. Sign up new members (students, faculty), update profiles, generate library cards, handle expiration and renewal.
- Book Cataloging. Add new books, assign ISBN or accession numbers, classify by Dewey Decimal or LCC, manage multiple copies, track location (shelf or section).
- Borrowing and Returning. Issue books to members, record due dates, scan returns, calculate overdue days, update copy availability.
- Reservation. Allow members to reserve unavailable books, queue waitlists, notify when available.
- Fine Management. Calculate overdue fines, accept payment, mark cleared, restrict borrowing for unpaid members.
- Reports. Generate borrowing statistics, popular books, overdue lists, member activity, and inventory audits for the librarian and administrator.
For this guide, we will model these six modules with three external entities (Member, Librarian, Administrator) and four data stores (Members, Books, Transactions, Fines). This is the typical scope for a 12 to 16 week BSIT capstone. If your project is bigger, for example multi-branch, e-book lending, or mobile app integration, then add 1 to 2 more processes and 1 to 2 more data stores per extension.
If you are still choosing between system topics, our DFD for Hospital Management System guide follows the same structure and may help you compare scopes.
DFD Level 0 (Context Diagram)
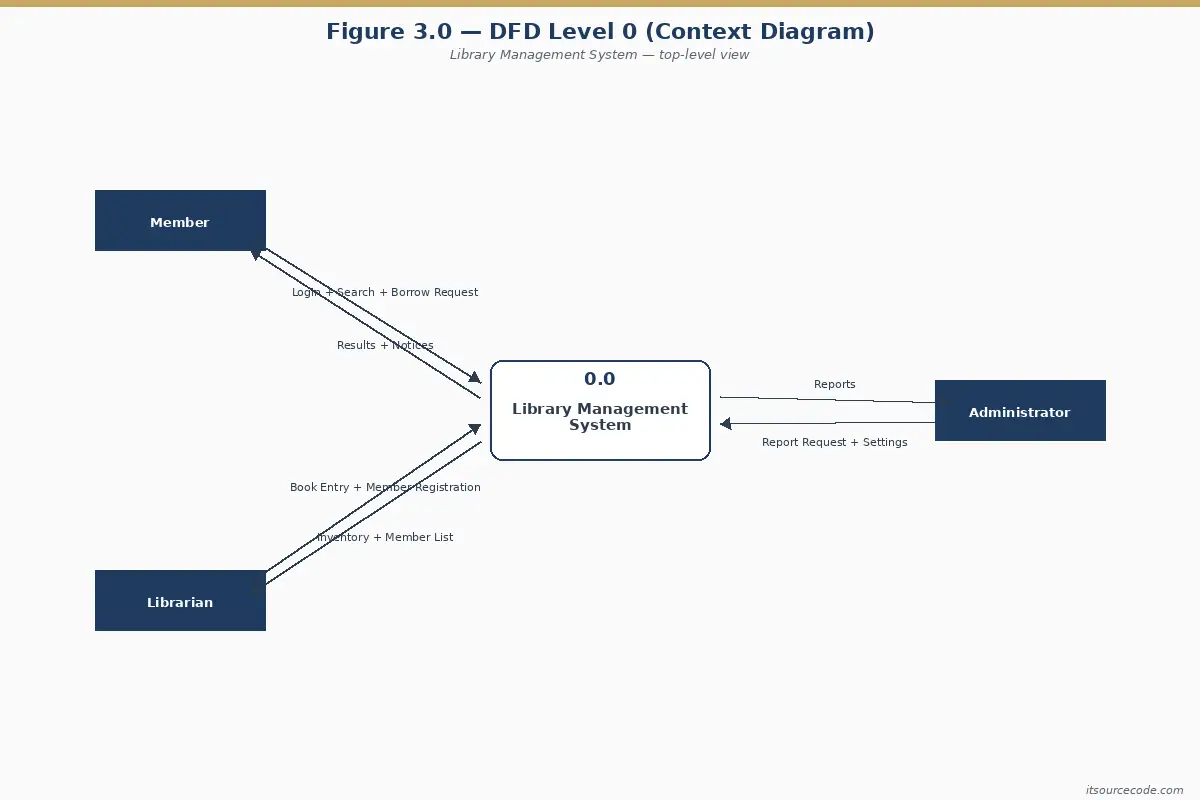
Level 0, also called the Context Diagram, shows the entire system as a single process bubble. No internal detail, no data stores, no subprocesses. Just the system, all the external entities, and the major data flows in and out.
The purpose of Level 0 is to define the system boundary. What is inside (your responsibility to build), and what is outside (external actors you will interact with).
What’s in Level 0
One process bubble (numbered 0 or unnumbered), all three external entities, and labeled data flows between each entity and the system. No data stores at Level 0. Those only appear from Level 1 onwards.
Caption: Figure 3.1. Level 0 Data Flow Diagram of the Library Management System.
Explanation paragraph (for Chapter 3): Figure 3.1 presents the Level 0 (Context) Data Flow Diagram of the proposed Library Management System. Three external entities interact with the system. Members (who register, request books, and receive library cards and overdue notices), Librarians (who maintain the book catalog and member records), and Administrators (who request reports and manage system-wide settings). The Level 0 diagram establishes the system boundary and the major data exchanges with each external entity, without showing internal processes or data stores.
DFD Level 1 (Main Processes)
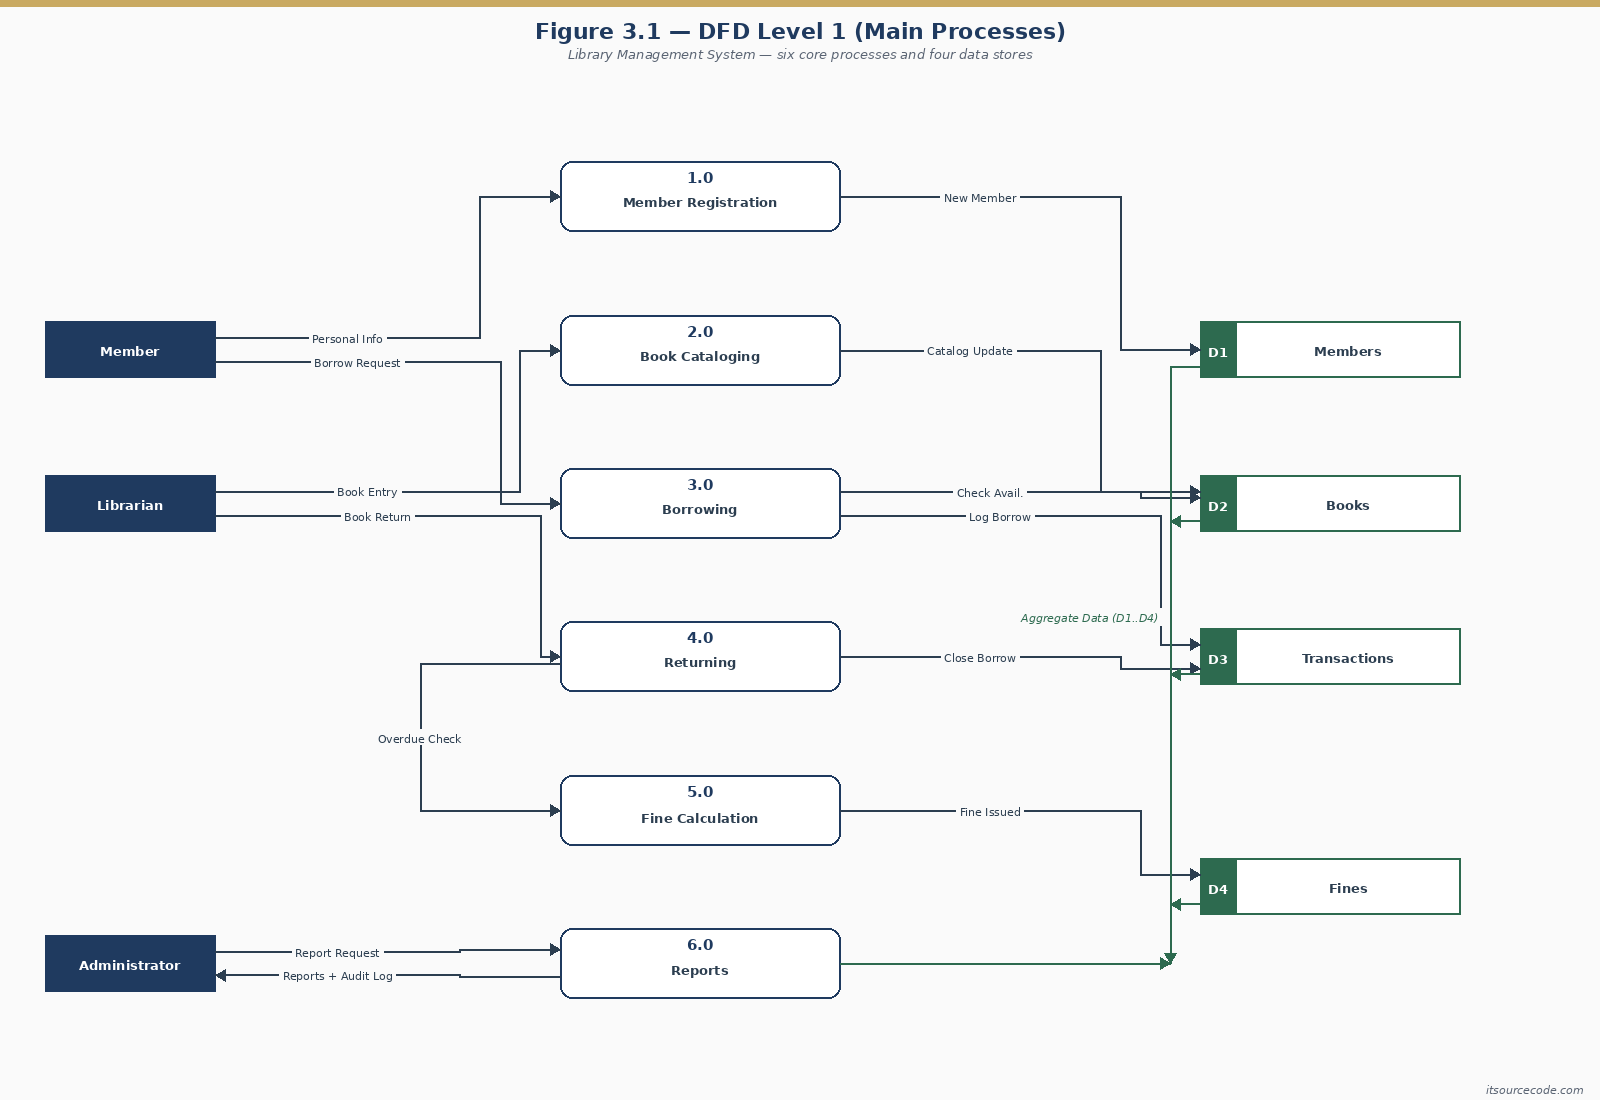
Level 1 decomposes the single Level 0 bubble into the main processes of the system. This is also where data stores first appear. For our Library Management System, Level 1 shows six processes, four data stores, and all labeled data flows between processes, entities, and stores.
What’s in Level 1
Six process bubbles (1.0 through 6.0), all three external entities from Level 0, four data stores (D1 Members, D2 Books, D3 Transactions, D4 Fines), and every data flow labeled.
Process explanations
1.0 Member Registration. Accepts new member sign-ups, validates required fields (name, ID number, contact, member type), writes the new member record to D1 Members, then issues a library card with member ID and expiration date.
2.0 Book Cataloging. Accepts book data from the librarian (title, author, ISBN, classification, copies), writes the catalog entry to D2 Books, then returns a confirmation. It also handles updates and deletions for existing entries.
3.0 Borrowing and Returning. Handles both directions of book circulation. For borrowing, it verifies the member is active in D1, checks book availability in D2, records the transaction in D3, marks the copy as borrowed, then issues a slip with due date. For returning, it scans the returned copy, calculates overdue days, updates the transaction record, marks the copy as available, then forwards any overdue case to Process 5.0.
4.0 Reservation. Allows members to reserve a book that is currently borrowed. Checks D2 Books for current status, queues the reservation in D3 Transactions, then notifies the member when the book becomes available.
5.0 Fine Management. Calculates overdue fines based on transaction data from D3, records the fine in D4 Fines, accepts payment from the member, then updates the fine status to “paid.” Members with unpaid fines above a threshold are flagged in D1 Members to block further borrowing.
6.0 Reports. Responds to administrator queries by reading from all four data stores, producing reports on member activity, popular books, overdue lists, fine collections, and inventory audits.
Caption: Figure 3.2. Level 1 Data Flow Diagram of the Library Management System.
DFD Level 2 (Subprocess Decomposition)
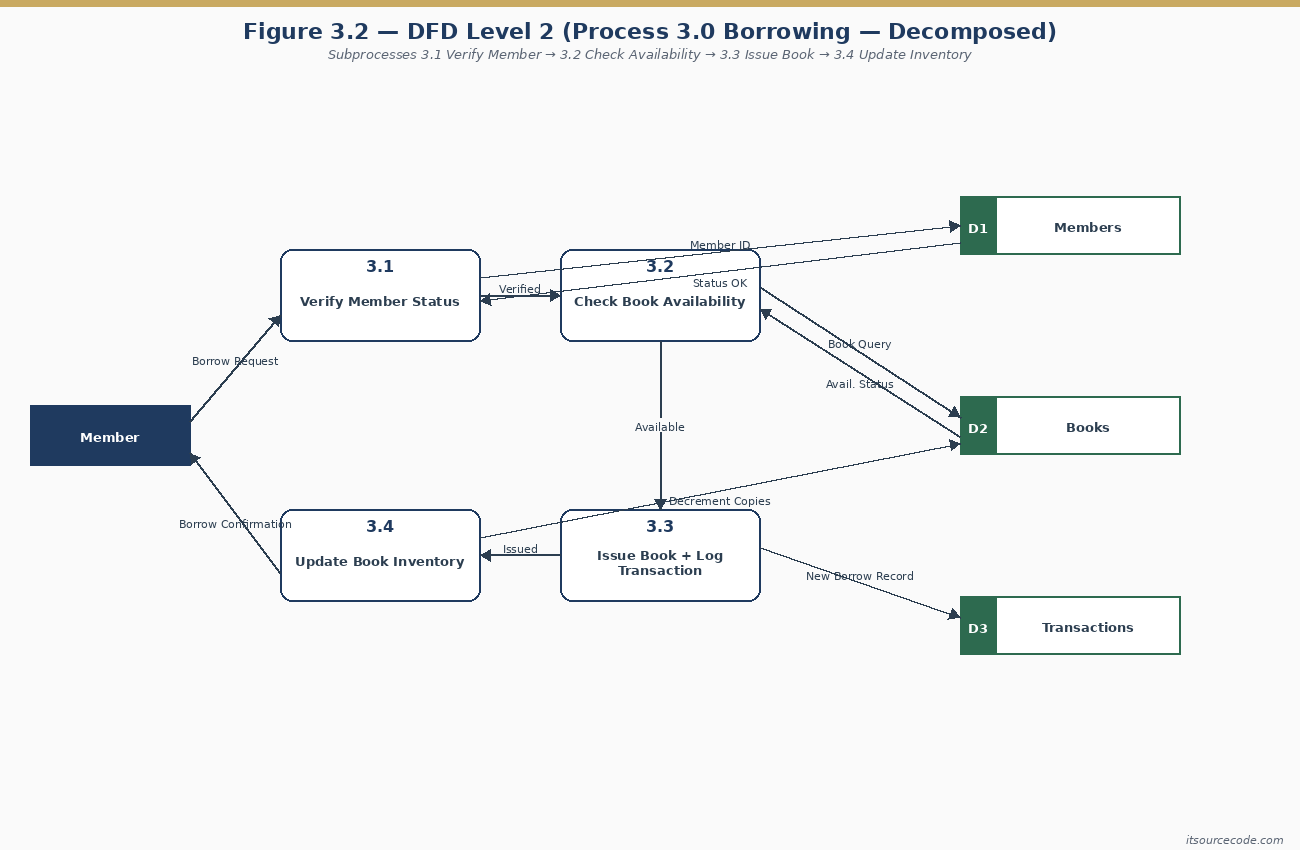
Level 2 takes one Level 1 process and decomposes it into its subprocesses. You don’t need a Level 2 diagram for every Level 1 process. Only the complex ones that benefit from showing internal structure. For a Library Management System, the obvious candidate is Process 3.0 (Borrowing and Returning). It has the most logic, validation, and data writes.
What’s in Level 2
Five subprocess bubbles (3.1 through 3.5), numbered as children of 3.0. Also, the external entities and data stores that touch Process 3.0, and the detailed internal data flows showing the sequence of operations.
Subprocess explanations
3.1 Verify Member. Looks up the member in D1 Members, confirms their account is active, not blocked for unpaid fines, and within borrowing limits. Returns validated member context to the next subprocess.
3.2 Check Book Availability. Looks up the book in D2 Books, finds an available copy (some titles have multiple copies), then reserves it for issue. If no copy is available, redirects to Process 4.0 (Reservation).
3.3 Issue Book. Writes the borrow transaction to D3 Transactions with due date, updates the copy status in D2 Books to “borrowed,” then prints or displays an issue slip to the member.
3.4 Process Return. Accepts the returned book, looks up the original transaction in D3, updates the copy status in D2 Books back to “available,” then forwards the transaction to overdue calculation.
3.5 Compute Overdue. Calculates the number of days between the due date and the actual return date. If positive (overdue), it forwards to Process 5.0 (Fine Management) to log a fine. It issues a return receipt to the member either way.
Caption: Figure 3.3. Level 2 Data Flow Diagram of Process 3.0 Borrowing and Returning.
DFD Symbols Quick Reference
| Element | Yourdon | Gane-Sarson | Library example |
|---|---|---|---|
| External Entity | Rectangle | Rectangle with shadow | Member, Librarian, Administrator |
| Process | Circle | Rounded rectangle | 3.0 Borrowing and Returning |
| Data Store | Two parallel lines | Open-ended rectangle | D2 Books, D3 Transactions |
| Data Flow | Labeled arrow | Labeled arrow | “Borrow Request,” “Fine Notice” |
Yourdon notation (circles for processes) is the de facto standard in Filipino BSIT capstones. Gane-Sarson (rounded rectangles) is more common in business systems analysis programs. Pick one and stay consistent across all three levels of your DFD set. Mixing styles is one of the fastest ways to get sent back by your panel.
Common Mistakes in Library DFDs
I have here eight patterns we see kill DFD sections in Library Management System capstones during panel reviews. Avoid these and your defense will go much smoother.
- Treating the Librarian as an internal process. The librarian is an external entity. A person outside the software boundary, even if they are inside the physical library. The system serves the librarian. It does not contain the librarian.
- Black-hole processes. Data goes into “Process Borrow Request” and nothing comes out. Every process needs at least one input and one output. The output for a borrow process is the issue slip, plus the updated transaction record.
- Member writes directly to D1 Members. External entities cannot write directly to a data store. They must go through a process (1.0 Member Registration). The same rule applies for reading.
- Unlabeled flows. Every arrow needs a specific name like “Borrow Request,” “Fine Notice,” or “Library Card.” Not “data,” not “info,” not blank.
- Level 0 with multiple bubbles. Level 0 is one bubble representing the entire system. If your context diagram has multiple bubbles, then you have drawn Level 1 by mistake.
- Combining “Borrowing” and “Fines” into one process. They are related but distinct. Borrowing creates a transaction. Fines are derived from overdue transactions. Splitting them keeps each process focused (single-responsibility).
- Forgetting the Reservation flow. Many beginner DFDs only handle borrow and return. Real libraries support reservations, and panels surely ask about it. Include Process 4.0 even if the wait queue logic is simple.
- Inconsistent numbering between levels. Process 3.0 in Level 1 must decompose to 3.1, 3.2, 3.3 in Level 2. Not 4.1 or 1.1. The number chain shows the parent-child relationship.
How to Draw This DFD in draw.io (Step-by-Step)
draw.io (now diagrams.net) is the recommended tool for BSIT capstone DFDs. It is free, browser-based, has built-in DFD shape libraries for both Yourdon and Gane-Sarson notation, then exports cleanly to PNG and PDF for your Chapter 3 documentation.
- First, open draw.io at app.diagrams.net. Choose “Create New Diagram,” then “Blank Diagram.” Save to Google Drive or your local device.
- Second, enable DFD shapes. In the left panel, click “More Shapes” at the bottom. Check “Software,” then check “Yourdon and Coad” (or “Gane-Sarson” if you prefer that notation), then Apply. The DFD shapes will now appear in the left sidebar.
- Third, draw Level 0 first. Drag one circle to the center, label it “0 Library Management System.” Place three rectangles around it. Member on the left, Librarian on the right, then Administrator on the top-right. Connect each entity to the system bubble with labeled arrows. Save as dfd-level-0.drawio.
- Next, draw Level 1. Create a new page (tab at the bottom). Place six process circles in a logical layout. Top-to-bottom usually works. 1.0 Member Registration, 2.0 Book Cataloging, 3.0 Borrowing and Returning, 4.0 Reservation, 5.0 Fine Management, then 6.0 Reports. Add the four data stores (D1 Members, D2 Books, D3 Transactions, D4 Fines) and the three external entities. Connect with labeled flows. This page is dense, so give yourself space.
- Then, draw Level 2 for Process 3.0. New page. Place five subprocess circles (3.1 through 3.5). Show only the data stores and entities that touch Process 3.0. Connect with labeled flows.
- Also, export each level as PNG. File, then Export As, then PNG. Set border to 20px, transparent background off (use white). Export at 200 DPI for crisp printing in your Chapter 3 PDF.
- Finally, insert into Chapter 3. In Word or LaTeX, insert each PNG, add a numbered caption below (Figure 3.1, 3.2, 3.3), then write the explanation paragraph above each figure. Reference each figure by number in the body text (“As shown in Figure 3.2…”).
For the Chapter 3 structure overall, see our Chapter 3 Methodology guide. It walks through the surrounding sections (3.1 Research Design, 3.5 System Architecture) that your DFD fits into.
Working library management source code that implements this diagram
The diagram above defines the flows; these are the actual library management systems on itsourcecode.com that implement them. Pick one in your team’s stack and you have a working reference to point your panel at when they ask “show me where this flow actually runs in code.”

PHP: Library Management System in PHP
Vanilla PHP + MySQL. Book catalog, borrow/return, fines, reports. Direct map to the data flows above.
Java: Library Management System in Java
Java Swing + JDBC + MySQL. NetBeans-ready for OOP defense.

ASP.NET: Library Management System in ASP.NET
C# + SQL Server. Controllers mirror Level 1 process boundaries.

VB.NET: Library Management System in VB.NET
VB.NET + MySQL. Windows Forms with cataloging + circulation flows, classic local-deployment build.

Django (Python): Django Library Management System
Django 4 + Bootstrap. Class-based views match your DFD entities directly.
How to use this for your Chapter 3 (Methodology): download the project in your stack, then map each process and data store in this diagram to a specific module, controller, or table in the downloaded source. That mapping IS the bridge between your design chapter and your implementation chapter, the single thing panels want to see traced end to end.
Official documentation
Working source code for this system
Download the actual implementation of this system in your preferred language. Each project includes source code, database, and setup instructions for BSIT capstone use.
- PHP: Library Management System Project in PHP with Source Code
- VB.NET: Library Management System for St. Columban’s Academy in VB.net
- Java: Library Management System Project In Java With Source Code
- Python: Django Library Management System with Source Code
- Django: Django Library Management System with Source Code
- Laravel: Library Management System Project in Laravel With Source Code
Frequently Asked Questions
What is a DFD for a Library Management System?
What are the external entities in a Library Management System DFD?
How many processes should be in Level 1 of a Library DFD?
What data stores should I include in a Library DFD?
Which process should I decompose in Level 2?
What’s the difference between Level 0, Level 1, and Level 2 DFDs?
What tool should I use to draw the Library DFD?
Can a member write directly to the database in a DFD?
Do I need both DFD and UML diagrams in my capstone?
Where do DFDs go in capstone documentation?
Get the full DFD as a printable PDF
All 3 levels (0, 1, 2) in one file. Ready for Chapter 3 documentation.
Download the Library Management System DFD (PDF)Final Recommendation
If you take only one habit from this guide, make it this. Sketch all three DFD levels on paper first, before opening draw.io. Most students who get sent back by their panel did not think through the data flow. They jumped straight into a diagramming tool, then ended up with arrows that don’t quite make sense. Five minutes on paper saves an hour of re-drawing.
First, lock down your scope. Six processes, four data stores, three external entities is the standard Library Management System shape. Then, draw Level 0 today. Next, draw Level 1 by the end of the week. Finally, draw Level 2 for Process 3.0 by next Monday. By then, you will understand your system better than 90% of the teams who skipped this exercise. Your Chapter 3 will also pass the panel review on diagram structure alone.
Your next steps to take:
- Sketch Level 0 on paper. One bubble, three external entities, labeled flows.
- Sketch Level 1. Six processes, four data stores, all flows labeled.
- Sketch Level 2 for Process 3.0 (Borrowing and Returning). Five subprocesses.
- Redraw all three in draw.io using Yourdon notation.
- Compare with the Hospital Management DFD to sanity-check your structure.
- Browse more DFD guides, the full UML library, or pick a topic from our 150 Capstone Ideas 2026.
By the way, after you finish your DFD, you might also need other diagrams for your capstone documentation. We have guides for the Use Case Diagram, Class Diagram, Activity Diagram, and Sequence Diagram. All are common requirements in Chapter 3 alongside the DFD.
I hope this article helps you defend your capstone successfully. If you have any questions or suggestions regarding this topic about DFDs for Library Management Systems, please feel free to contact me at our contact page. Or, you can also add me on Facebook at https://www.facebook.com/joken.villanueva.

Mary Grace G. Patulada
Programmer & Technical Writer at PIES IT Solution
Mary Grace G. Patulada (pen name ‘Nym’) is a programmer and writer at PIES IT Solution with a BSIT background from Carlos Hilado Memorial State College, Binalbagan Campus. Authored 370+ UML diagram tutorials and capstone documentation guides at itsourcecode.com. Specializes in UML (class, use case, activity, sequence, component, deployment), DFD, and ER diagrams for BSIT capstone projects.
Expertise: UML Diagrams · DFD · ER Diagrams · Use Case Diagrams · Activity Diagrams · Capstone Documentation · PHP · View all posts by Mary Grace G. Patulada →