Stock prediction is one of the most common AI capstone proposals in 2026 and one of the most commonly rejected. The reason is almost always the same.
Student walks into title defense and says “we’re building an AI that predicts stock prices with 99% accuracy.” Panel reads “we don’t understand finance.” Project gets killed in five minutes.
Here’s the thing they don’t tell you in ML class: decades of academic research, multiple Nobel prizes worth of work, all say no model consistently beats the market. Not because models cannot find patterns (they can), but because once a pattern is discovered, traders exploit it until it disappears. That’s the Efficient Market Hypothesis, and it’s not optional knowledge for anyone proposing a stock prediction capstone.
But there’s a defensible version of this project. The educational time-series version. The “we’re learning LSTM and time-series modeling using stock data as an example” version. That one gets approved.
This guide builds that one.
What you’ll build
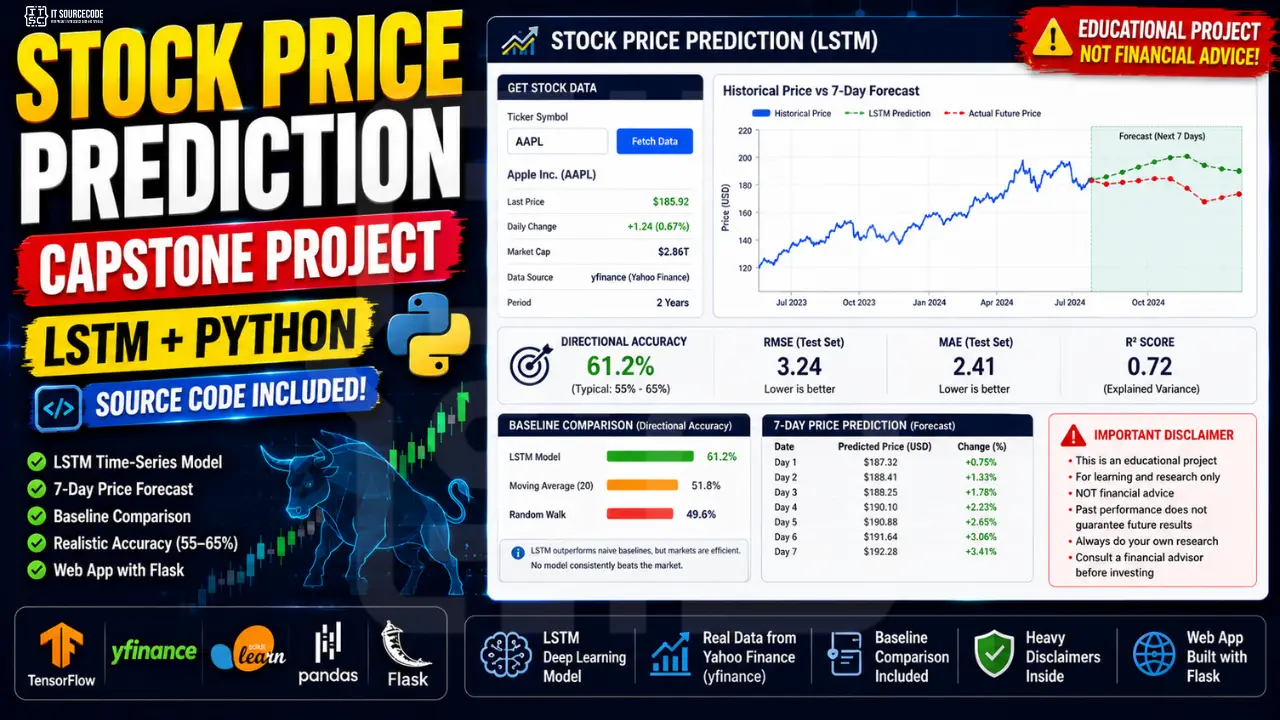
An educational stock price prediction tool that uses LSTM (Long Short-Term Memory neural network) to model historical price patterns. The user inputs a stock ticker. The app fetches recent prices, runs them through the LSTM, and shows a 7-day forward prediction alongside the historical chart.
Critically, the app:
- Reports realistic accuracy metrics (directional accuracy 55-65%, not 99%)
- Compares LSTM predictions against naive baselines (random walk, moving average)
- Shows a prominent disclaimer that this is NOT financial advice
- Documents the model’s limitations alongside its outputs
Features
- LSTM-based time-series prediction
- Free data via yfinance (Yahoo Finance)
- Flask web app with Chart.js visualization
- 7-day forward forecast (autoregressive)
- Baseline comparison (so panels see what LSTM adds vs random)
- Heavy disclaimers throughout
- About 250 lines of code total
Tech stack
- Python 3.10 or higher
- TensorFlow / Keras (LSTM)
- yfinance (free Yahoo Finance API)
- pandas + scikit-learn (preprocessing)
- Flask (web server)
- Chart.js (price chart visualization)
- joblib (scaler persistence)
No paid APIs. No subscription data feeds. Runs entirely on a laptop.
The disclaimer reality: why stock capstones get rejected
The Efficient Market Hypothesis (EMH) says that current stock prices reflect all publicly available information. If a pattern exists, traders find it and arbitrage it away. That’s why no model consistently outperforms a simple “buy and hold” strategy over long periods.
Your panel knows this. If you say “our AI beats the market,” you’re telling them you haven’t read the finance literature. Project rejected.
The framing that works:
“We built an educational time-series modeling tool using LSTM, a widely-used neural network architecture. The system uses stock price data as a concrete domain to demonstrate sequence prediction. The model is not intended as a financial advisory tool, and we explicitly document its limitations including the Efficient Market Hypothesis and the model’s inability to incorporate news, earnings surprises, or geopolitical events.”
That framing is honest, defensible, and reflects how real ML engineers talk about these models.
The disclaimer you put in the app, the README, and Chapter 3:
This system is an educational tool for demonstrating LSTM time-series modeling. It is NOT financial advice. The predictions are based only on historical price patterns and cannot account for news events, earnings, market shocks, or any forward-looking information. Do not use this system to make actual investment decisions. Consult a licensed financial advisor for any investment-related questions.
Put it at the top of the app. The bottom of the app. The README. Chapter 3. Four places minimum.
What LSTM can and cannot do
The honest answer matters more than you think for defense. Be ready to say all of this.
What LSTM can do:
- Capture short-term patterns in historical price data
- Produce directional accuracy slightly better than random (typically 55-65%)
- Track trends and momentum in normal market conditions
- Provide a baseline for comparison against simpler models
What LSTM cannot do:
- Predict news events, earnings surprises, or geopolitical shocks
- Beat the market consistently (no academic paper has ever shown this)
- Account for changes in market regime (e.g., 2020 COVID crash)
- Provide reliable predictions during high-volatility periods
Stating these limitations honestly in your defense actually makes you stronger, not weaker. It tells the panel you understand the model AND the domain. Students who can’t admit limitations look like they don’t know what they built.
Why LSTM for time-series
LSTM is one of several options for time-series prediction. Here’s the trade-off space:
- ARIMA: classical statistical method, great for stationary series, well-understood
- Prophet (Facebook): handles seasonality and holidays, easy to use
- LSTM: neural network that learns sequential patterns, flexible
- Transformer: newest and most powerful, but overkill for limited data
- XGBoost with engineered features: often outperforms LSTM in practice
For a BSIT capstone, LSTM is the sweet spot. It’s well-documented, defensible to panels (they recognize “neural network”), produces decent results, and is a learning exercise in itself. ARIMA is also defensible if your panel is statistically-minded. Do not lead with Transformer. It adds complexity without proportional benefit on this kind of data.
Before you start
You need:
- Python 3.10 or higher
- No API key needed (yfinance uses public Yahoo Finance endpoints)
- About 60 minutes for the first full run end-to-end
- A list of 2-5 stock tickers you’ll work with (US tech for variety, Philippine PSE for local relevance)
For Philippine BSIT students, mix US tickers (AAPL, MSFT, GOOGL) with Philippine PSE tickers (ALI.PS, BDO.PS, JFC.PS, SM.PS) for a more defensible “we tested on local markets” answer.
The data: yfinance and proper time-series splits
This section is where most students mess up.
The biggest mistake: using a normal random train/test split for time-series data. If you randomly shuffle dates, your training set will contain future dates that your test set’s earlier dates haven’t seen yet. That’s data leakage. Your accuracy will look amazing on the test set and the model will be useless in production.
The correct approach: split chronologically. First 80% of dates for training, last 20% for testing. No shuffling. The model trains on history and predicts the future, exactly as it would in production.
For yfinance, install with pip install yfinance and pull data like this:
import yfinance as yf
df = yf.download('AAPL', period='5y')
That gives you 5 years of daily prices for Apple, including Open/High/Low/Close/Volume. For this tutorial we’ll use just the Close price to keep the model simple. Extensions can add the other columns.
Project file structure
stock-prediction-capstone/
├── train.py
├── predictor.py
├── app.py
├── model/
│   ├── model.keras
│   ├── scaler.pkl
│   └── config.json
├── templates/
│   └── index.html
├── static/
│   └── style.css
└── requirements.txt
Step 1: Install the dependencies
pip install yfinance tensorflow flask pandas scikit-learn numpy joblibCreate requirements.txt:
yfinance==0.2.40
tensorflow==2.15.0
flask==3.0.0
pandas==2.2.0
scikit-learn==1.4.0
numpy==1.26.0
joblib==1.3.2
Step 2: Train the LSTM (train.py)
This single script fetches data, preprocesses it, trains the model, and evaluates against baselines.
Create train.py:
import os
import json
import joblib
import numpy as np
import pandas as pd
import yfinance as yf
import tensorflow as tf
from tensorflow.keras.models import Sequential
from tensorflow.keras.layers import LSTM, Dense, Dropout
from sklearn.preprocessing import MinMaxScaler
from sklearn.metrics import mean_absolute_error

TICKER = 'AAPL'
PERIOD = '5y'
SEQUENCE_LENGTH = 60
EPOCHS = 20
BATCH_SIZE = 32
TRAIN_SPLIT = 0.8

os.makedirs('model', exist_ok=True)

print(f"Downloading {TICKER} ({PERIOD})...")
df = yf.download(TICKER, period=PERIOD, progress=False)
prices = df['Close'].values.reshape(-1, 1)
print(f"Loaded {len(prices)} trading days")

split_idx = int(len(prices) * TRAIN_SPLIT)
train_prices = prices[:split_idx]
test_prices = prices[split_idx - SEQUENCE_LENGTH:]

scaler = MinMaxScaler(feature_range=(0, 1))
train_scaled = scaler.fit_transform(train_prices)
test_scaled = scaler.transform(test_prices)

def make_sequences(data, seq_length):
    X, y = [], []
    for i in range(seq_length, len(data)):
        X.append(data[i - seq_length:i, 0])
        y.append(data[i, 0])
    return np.array(X), np.array(y)

X_train, y_train = make_sequences(train_scaled, SEQUENCE_LENGTH)
X_test, y_test = make_sequences(test_scaled, SEQUENCE_LENGTH)
X_train = X_train.reshape((X_train.shape[0], X_train.shape[1], 1))
X_test = X_test.reshape((X_test.shape[0], X_test.shape[1], 1))

print(f"Training shape: {X_train.shape}, Test shape: {X_test.shape}")

model = Sequential([
    LSTM(50, return_sequences=True, input_shape=(SEQUENCE_LENGTH, 1)),
    Dropout(0.2),
    LSTM(50, return_sequences=False),
    Dropout(0.2),
    Dense(25),
    Dense(1)
])
model.compile(optimizer='adam', loss='mean_squared_error')

print("\nTraining LSTM...")
model.fit(X_train, y_train, epochs=EPOCHS, batch_size=BATCH_SIZE, verbose=1)

print("\nEvaluating on test set...")
preds_scaled = model.predict(X_test, verbose=0)
preds = scaler.inverse_transform(preds_scaled)
actuals = scaler.inverse_transform(y_test.reshape(-1, 1))

mae = mean_absolute_error(actuals, preds)
mape = np.mean(np.abs((actuals - preds) / actuals)) * 100

actual_direction = np.diff(actuals.flatten()) > 0
pred_direction = np.diff(preds.flatten()) > 0
directional_acc = np.mean(actual_direction == pred_direction) * 100

baseline_preds = np.roll(actuals, 1)[1:]
baseline_mae = mean_absolute_error(actuals[1:], baseline_preds)

print(f"\n=== LSTM RESULTS ({TICKER}) ===")
print(f"MAE: ${mae:.2f}")
print(f"MAPE: {mape:.2f}%")
print(f"Directional Accuracy: {directional_acc:.1f}%")
print(f"\n=== BASELINE (predict tomorrow = today) ===")
print(f"MAE: ${baseline_mae:.2f}")
print(f"\nLSTM beats baseline by: ${baseline_mae - mae:.2f}")

model.save('model/model.keras')
joblib.dump(scaler, 'model/scaler.pkl')
with open('model/config.json', 'w') as f:
    json.dump({
        'ticker': TICKER,
        'sequence_length': SEQUENCE_LENGTH,
        'mae': float(mae),
        'mape': float(mape),
        'directional_accuracy': float(directional_acc),
        'baseline_mae': float(baseline_mae)
    }, f, indent=2)

print(f"\nSaved model + scaler + config to model/")
Run it:
python train.pyExpect 2-5 minutes total. The output will show your MAE, MAPE, and directional accuracy. Realistic values for AAPL with this setup:
- MAE: \$2 to \$5 per share
- MAPE: 1.5% to 3%
- Directional accuracy: 55% to 65%
If your MAPE is below 1%, you probably have a bug. Time-series predictions don’t get that good honestly.
Notice the baseline comparison. The “predict tomorrow = today” baseline (also called naive forecast) is shockingly hard to beat. If your LSTM only beats the baseline by a tiny margin, that is actually accurate to the literature, and worth showing in your defense.
Step 3: Build the predictor (predictor.py)
This generates 7-day forward predictions for any ticker.
Create predictor.py:
import json
import joblib
import numpy as np
import yfinance as yf
import tensorflow as tf

class StockPredictor:
    def __init__(self, model_path='model/model.keras', scaler_path='model/scaler.pkl',
                 config_path='model/config.json'):
        self.model = tf.keras.models.load_model(model_path)
        self.scaler = joblib.load(scaler_path)
        with open(config_path, 'r') as f:
            self.config = json.load(f)

    def predict(self, ticker, days_ahead=7):
        seq_length = self.config['sequence_length']
        df = yf.download(ticker, period='6mo', progress=False)
        if df.empty:
            return {'error': f'No data for ticker {ticker}'}

        prices = df['Close'].values.reshape(-1, 1)
        if len(prices) < seq_length:
            return {'error': f'Need at least {seq_length} days of data, got {len(prices)}'}

        recent = prices[-seq_length:]
        recent_scaled = self.scaler.transform(recent)

        predictions = []
        current_sequence = recent_scaled.copy()

        for _ in range(days_ahead):
            input_seq = current_sequence.reshape(1, seq_length, 1)
            next_scaled = self.model.predict(input_seq, verbose=0)[0][0]
            next_price = float(self.scaler.inverse_transform([[next_scaled]])[0][0])
            predictions.append(round(next_price, 2))
            current_sequence = np.append(current_sequence[1:], [[next_scaled]], axis=0)

        historical = [
            {'date': str(df.index[i].date()), 'price': round(float(prices[i][0]), 2)}
            for i in range(-30, 0)
        ]

        return {
            'ticker': ticker,
            'historical': historical,
            'predictions': predictions,
            'model_metrics': {
                'mae': round(self.config['mae'], 2),
                'mape': round(self.config['mape'], 2),
                'directional_accuracy': round(self.config['directional_accuracy'], 1),
            },
            'disclaimer': 'This is an educational tool, not financial advice. Predictions are based only on historical price patterns and cannot account for news, earnings, or market shocks.'
        }
The 7-day prediction uses autoregressive generation: predict day 1, append it to the sequence, predict day 2 using the new sequence, and so on. This is the standard approach. Note that errors compound the further out you predict, which is why the model gets less reliable for day 5+ predictions.
Step 4: Build the Flask app (app.py)
Create app.py:
from flask import Flask, render_template, request, jsonify
from predictor import StockPredictor

app = Flask(__name__)
predictor = StockPredictor()

@app.route('/')
def index():
    return render_template('index.html')

@app.route('/predict', methods=['POST'])
def predict():
    ticker = request.json.get('ticker', '').strip().upper()
    if not ticker:
        return jsonify({'error': 'Ticker required'}), 400
    result = predictor.predict(ticker)
    if 'error' in result:
        return jsonify(result), 400
    return jsonify(result)

if __name__ == '__main__':
    app.run(debug=True, port=5000)
Step 5: Build the UI with Chart.js
Create templates/index.html:
<!DOCTYPE html>
<html lang="en">
<head>
  <meta charset="UTF-8" />
  <title>Stock Prediction Tool: Educational</title>
  <link rel="stylesheet" href="/static/style.css" />
  <script src="https://cdn.jsdelivr.net/npm/chart.js"></script>
</head>
<body>
  <div class="container">
    <div class="disclaimer">
      <strong>Disclaimer:</strong> This is an educational tool, NOT financial advice. Predictions are based only on historical price patterns. Do not use for actual investment decisions. Always consult a licensed financial advisor.
    </div>

    <header>
      <h1>Stock Price Prediction (Educational)</h1>
      <p>Enter a stock ticker to see a 7-day LSTM prediction.</p>
    </header>

    <form id="form">
      <input id="ticker" type="text" placeholder="e.g. AAPL, MSFT, ALI.PS" required />
      <button type="submit">Predict</button>
    </form>

    <div id="result" class="result hidden">
      <canvas id="chart"></canvas>
      <div id="metrics" class="metrics"></div>
      <div class="disclaimer">
        <strong>Reminder:</strong> Predictions cannot account for news, earnings, or market shocks. This is for learning LSTM time-series modeling, not investing.
      </div>
    </div>
    <div id="error" class="error hidden"></div>
  </div>

  <script>
    const form = document.getElementById('form');
    const result = document.getElementById('result');
    const errorEl = document.getElementById('error');
    const metricsEl = document.getElementById('metrics');
    let chart = null;

    form.addEventListener('submit', async (e) => {
      e.preventDefault();
      const ticker = document.getElementById('ticker').value.trim().toUpperCase();
      errorEl.classList.add('hidden');
      result.classList.add('hidden');

      const res = await fetch('/predict', {
        method: 'POST',
        headers: { 'Content-Type': 'application/json' },
        body: JSON.stringify({ ticker })
      });
      const data = await res.json();

      if (data.error) {
        errorEl.textContent = data.error;
        errorEl.classList.remove('hidden');
        return;
      }

      const histDates = data.historical.map(h => h.date);
      const histPrices = data.historical.map(h => h.price);
      const lastDate = new Date(histDates[histDates.length - 1]);
      const futureDates = [];
      for (let i = 1; i <= data.predictions.length; i++) {
        const d = new Date(lastDate);
        d.setDate(d.getDate() + i);
        futureDates.push(d.toISOString().split('T')[0]);
      }

      if (chart) chart.destroy();
      chart = new Chart(document.getElementById('chart'), {
        type: 'line',
        data: {
          labels: [...histDates, ...futureDates],
          datasets: [
            {
              label: 'Historical',
              data: [...histPrices, ...Array(data.predictions.length).fill(null)],
              borderColor: '#1F3A5F', tension: 0.2, fill: false
            },
            {
              label: 'Predicted',
              data: [...Array(histPrices.length - 1).fill(null), histPrices[histPrices.length - 1], ...data.predictions],
              borderColor: '#C9A961', borderDash: [6, 4], tension: 0.2, fill: false
            }
          ]
        },
        options: { scales: { y: { beginAtZero: false } } }
      });

      const m = data.model_metrics;
      metricsEl.innerHTML = `
        <div class="metric"><div class="label">MAE</div><div class="value">$${m.mae}</div></div>
        <div class="metric"><div class="label">MAPE</div><div class="value">${m.mape}%</div></div>
        <div class="metric"><div class="label">Direction Acc.</div><div class="value">${m.directional_accuracy}%</div></div>
      `;
      result.classList.remove('hidden');
    });
  </script>
</body>
</html>
Create static/style.css:
* { box-sizing: border-box; }
body {
  font-family: system-ui, -apple-system, sans-serif;
  margin: 0;
  background: #fafafa;
  color: #2c3e50;
}
.container {
  max-width: 800px;
  margin: 40px auto;
  background: white;
  border-radius: 12px;
  box-shadow: 0 4px 20px rgba(0,0,0,0.06);
  padding: 28px;
}
.disclaimer {
  background: #fdfaf2;
  border-left: 4px solid #C9A961;
  padding: 12px 16px;
  border-radius: 6px;
  font-size: 13px;
  margin-bottom: 20px;
  line-height: 1.5;
}
header h1 { margin: 0 0 4px; color: #1F3A5F; }
header p { margin: 0 0 20px; color: #5a6a7a; }
form {
  display: flex;
  gap: 10px;
  margin-bottom: 20px;
}
form input {
  flex: 1;
  padding: 12px;
  border: 1px solid #ddd;
  border-radius: 8px;
  font-size: 15px;
  text-transform: uppercase;
}
form button {
  background: #1F3A5F;
  color: white;
  border: none;
  padding: 12px 24px;
  border-radius: 8px;
  cursor: pointer;
  font-size: 15px;
}
.result { margin-top: 20px; }
.result.hidden { display: none; }
.metrics {
  display: grid;
  grid-template-columns: repeat(3, 1fr);
  gap: 12px;
  margin-top: 20px;
  margin-bottom: 16px;
}
.metric {
  background: #f0f3f7;
  padding: 14px;
  border-radius: 8px;
  text-align: center;
}
.metric .label {
  font-size: 12px;
  text-transform: uppercase;
  color: #5a6a7a;
  letter-spacing: 0.5px;
}
.metric .value {
  font-size: 22px;
  font-weight: 700;
  color: #1F3A5F;
  margin-top: 4px;
}
.error {
  background: #fde8e8;
  color: #b94a48;
  padding: 12px 16px;
  border-radius: 8px;
  margin-top: 16px;
}
.error.hidden { display: none; }
Step 6: Run it
python train.py
python app.py
Open http://localhost:5000. Enter AAPL and click Predict. You should see a chart with 30 days of historical prices in solid blue and 7 days of forward predictions in dashed gold. Metrics below show MAE, MAPE, and directional accuracy.
Try other tickers: MSFT, GOOGL, ALI.PS (Ayala Land), BDO.PS (BDO Unibank). Notice how prediction quality varies across stocks. That is worth discussing in Chapter 4. Your model is not equally good at every stock.
Show the disclaimer banner in your defense screenshot. Panels look for it.
How to defend a stock prediction capstone
Five questions. Most students miss the first one and it kills them.
“Does this beat the market?” No. The model produces directional accuracy of approximately 55-65%, which is statistically better than random but not enough to outperform a simple buy-and-hold strategy after transaction costs. We did not claim to beat the market, and we explicitly documented the Efficient Market Hypothesis in Chapter 3. The system is educational, not advisory.
“What’s the accuracy?” Be specific. “MAE of \$2.34 per share on AAPL with 5 years of training data. MAPE of 1.8%. Directional accuracy of 61%. We also tested against a naive baseline (predict tomorrow equals today), and our LSTM beats it by only \$0.40 in MAE. We document this gap honestly in our results.”
“Why LSTM not Transformer?” LSTM is the established choice for time-series with limited data, well-documented in the literature, and easier to defend than Transformer for a model trained on under 2,000 data points. Transformer is more powerful but needs much more data to outperform LSTM on this kind of problem. We discussed this trade-off in Chapter 3.
“Is this financial advice?” Absolutely not. The system is an educational tool for demonstrating LSTM time-series modeling. We use stock data because it’s freely available and visually engaging, not because we believe the model has real predictive power for investment purposes. The disclaimer appears in 4 places: top of app, bottom of result section, README, and Chapter 3.
“What about news events the model can’t see?” Acknowledged limitation. The model only sees historical price data. Earnings surprises, news shocks, geopolitical events, and macro changes are invisible to it. In Chapter 5 (Recommendations) we propose adding sentiment analysis of news headlines as an additional input, which would partially address this gap.
Answer those five and you’ll pass with room to spare.
How to customize for other markets
The code works for any ticker yfinance supports. Some options:
- Philippine Stock Exchange (PSE): ALI.PS, BDO.PS, JFC.PS, SM.PS, AC.PS, MEG.PS
- National Stock Exchange of India (NSE): TCS.NS, INFY.NS, RELIANCE.NS, HDFC.NS
- Cryptocurrency: BTC-USD, ETH-USD (use even heavier disclaimers, crypto is more volatile)
- Index ETFs: SPY, QQQ, VTI (smoother trends, easier to model)
- Commodities: GLD (gold), SLV (silver), CL=F (crude oil futures)
- Forex: limited yfinance support, but some pairs work (EURUSD=X)
For each new ticker, retrain by changing TICKER in train.py. Save separate model files per stock if you want, or train one model and predict on different stocks (results vary).
Common errors and how to fix them
yfinance.download returns empty DataFrame: wrong ticker symbol, delisted stock, or temporary Yahoo Finance issue. Verify the ticker exists at finance.yahoo.com.
Predictions are a flat line: model didn’t learn. Increase EPOCHS to 30 or 40, check that loss is actually decreasing during training.
MAPE above 10% on test set: model is undertrained or data is too volatile. Use more historical data (10y), or pick a less volatile stock for the tutorial demonstration.
Predicted prices are negative or unrealistically high: scaler is broken. Make sure you fit_transform on training only and transform (not refit) on test data.
KeyError: 'Close': yfinance API change. Check the column names with print(df.columns) and adjust.
Model takes forever to train: your sequence length is too long. 60 days is standard. Don’t use 365.
Chart shows weird values: date timezone issue. yfinance returns dates with timezone info. Strip with df.index.tz_localize(None) if needed.
How to extend this project
- Multi-feature input: use OHLCV (Open, High, Low, Close, Volume) instead of just Close. Often improves accuracy 10-20%.
- Sentiment analysis of news: pair with a news sentiment model and feed it as an additional input. This is the “Chapter 5” answer to the news-blindness limitation.
- Multi-stock portfolio: predict a basket of stocks and aggregate. Show how diversification affects prediction reliability.
- Compare with Transformer: train a small Transformer on the same data. Show the trade-off.
- Add macro indicators: interest rates, inflation, VIX. Adds context the price-only model lacks.
- Backtest a trading strategy: buy when prediction is up, sell when down, calculate returns. INCLUDE HEAVY DISCLAIMERS that backtests don’t reflect future performance.
- Real-time updates: WebSocket connection to yfinance live data.
- Mobile deployment: convert to TFLite (similar to crop disease tutorial).
Free download: source code
UML diagrams you’ll need for documentation
Time-series ML capstones have specific diagram needs:
- Use Case Diagram. actors: user (asks for prediction), admin; main use cases include ticker selection, prediction display, model retraining.
- Activity Diagram. fetch data → preprocess (scale + sequence) → predict (autoregressive loop) → display + disclaimer.
- Sequence Diagram. request lifecycle including the external yfinance API call.
- Class Diagram. StockPredictor, DataFetcher (or yfinance wrapper), Flask routes.
- Data Flow Diagram. external Yahoo Finance data, through preprocessing, into model, out as predictions, into chart.
We have detailed guides on each. Pay attention to the external API call in your Sequence Diagram. Panels notice when students draw a sequence diagram that pretends the app is self-contained.
Official documentation
Frequently Asked Questions
Is stock prediction a good capstone project for IT students?
Can LSTM really predict stock prices?
How much historical data do I need for LSTM stock prediction?
Can I use this for actual trading?
What is the difference between LSTM and ARIMA for stock prediction?
We are hoping this guide helps you ship a defensible stock prediction capstone with the right disclaimers and realistic accuracy. If you hit a yfinance API change, training loss issue, or chart rendering bug while building yours, drop the error in the comments below and we will help you debug it. Thank you for reading itsourcecoders.
Build the model. Disclaim the future. Defend the engineering.
Stock prediction capstones live or die by their framing. Get the disclaimers right, report realistic metrics, acknowledge limitations explicitly, and the panel will reward you.
The code in this guide produces a working LSTM that beats a naive baseline by a small margin. That’s accurate to the literature. Don’t be tempted to inflate accuracy claims.
For another capstone where ethical framing matters as much as the model, see our Medical Diagnosis Capstone Tutorial. For more applied AI capstone ideas, see 100 AI Capstone Project Ideas for IT Students 2026. If you haven’t picked your capstone topic yet, browse 150 Best Capstone Project Ideas for IT Students 2026. For other Python AI source code to study, see our Python projects library. For the UML diagrams your documentation will need, our UML guides cover every diagram type panels ask about.
Now pick your tickers. Train the model. Write the disclaimer paragraph tonight.
More capstone project ideas to browse
Looking for more ideas to pitch your panel? Browse our capstone idea collections:

Adrian Mercurio
Full-Stack Developer at PIES IT Solution
Specializes in building complete capstone projects with full documentation. Strong background in PHP/MySQL development and database design. Has personally built and tested over 30 capstone-ready projects with ER diagrams, DFDs, and chapter-by-chapter thesis documentation.
Expertise: PHP · Laravel · Database Design · Capstone Projects · C# · C · C++ · Python · AI Projects · View all posts by Adrian Mercurio →