Most Gantt Chart Capstone Projects by BSIT students look like they were drawn in MS Paint at the last minute, and panels notice.
A clean Gantt chart in Appendix B signals that you actually managed your project across 12 weeks, not just survived it.
A poorly made Gantt chart can cost you points even when everything else is solid, while a well‑designed one earns you points before the panel reads a single chapter.
This guide gives you a Gantt chart template panels respect, with sample timelines for both 12-week (typical) and 16-week (thesis-grade) capstones. Excel and Google Sheets versions are downloadable at the end.
If you’re following our Chapter 3 Methodology guide and using Agile Scrum, this Gantt chart slots directly into Section 3.5 of your documentation and Appendix B.
What a capstone Gantt chart actually shows
A Gantt chart is a horizontal bar chart with time on the X-axis and tasks on the Y-axis. Each bar represents a task or phase, showing when it starts, how long it takes, and when it ends.
For a capstone, your Gantt chart shows five things:
- Project phases over time: planning, literature review, development, testing, documentation
- Sprint structure: if you’re using Agile Scrum
- Milestone deadlines: proposal defense, system completion, UAT, final defense
- Team member task assignments: optional but impressive
- Critical path: the sequence of tasks that determines your total timeline
The chart should fit on one printed page if possible. Two pages is acceptable for thesis-grade work. Three pages means you’re over-detailing.
Where the Gantt chart lives in your documentation
Two places, always:
Appendix B. This is where the full-size chart goes. Most schools place the Gantt chart as Appendix B specifically, between Appendix A (Source Code) and Appendix C (Questionnaire). Some schools use different lettering, so check your manual.
Chapter 3, Section 3.5. Your Software Development Methodology section references the chart with a phrase like “Figure 3.1 shows the Gantt chart of the development phases, included as Appendix B.” The chart itself doesn’t appear in the chapter body, but the reference does.
If your methodology mentions Agile sprints, your Gantt chart must show those sprints. If the chapter says “6 sprints of 2 weeks each” but the Gantt only shows 4 sprints, panels will catch the inconsistency in seconds.
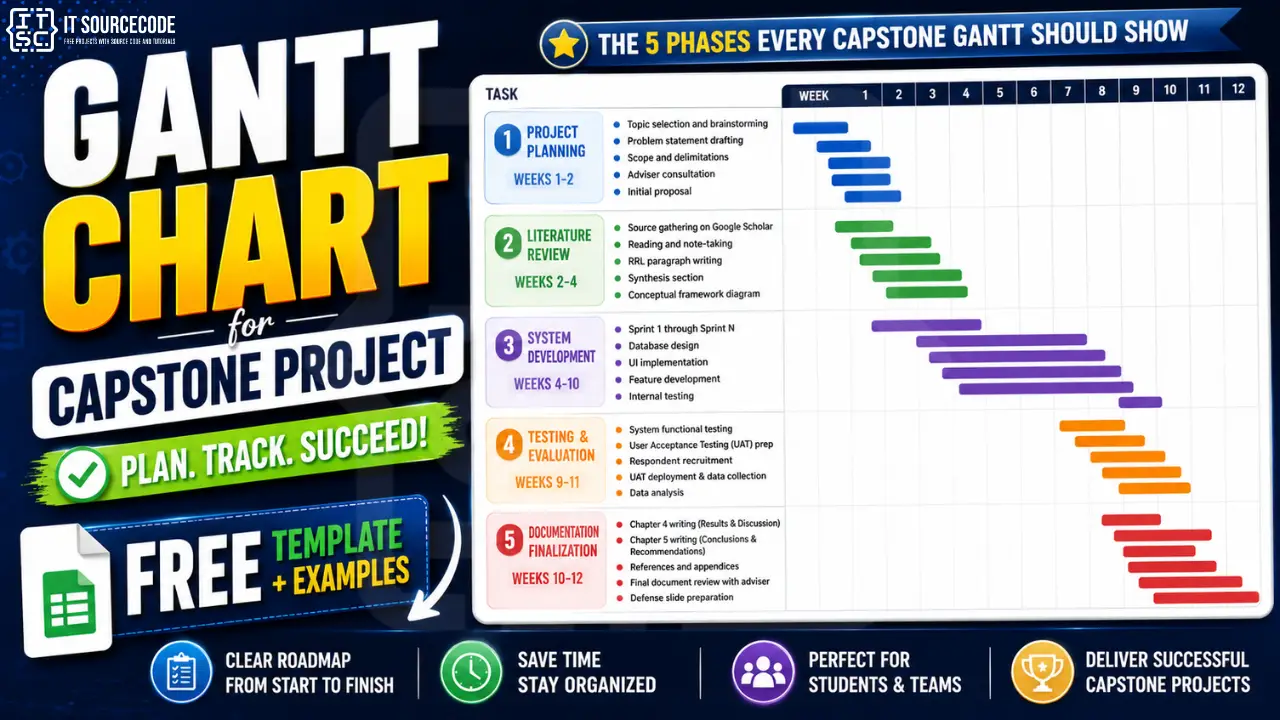
The 5 phases every capstone Gantt should show
Most BSIT capstones follow this 5-phase structure. Adapt the durations to your specific timeline.
1: Project Planning (Weeks 1-2)
- Topic selection and brainstorming
- Problem statement drafting
- Scope and delimitations
- Adviser consultation
- Initial proposal
2: Literature Review (Weeks 2-4, overlaps with Phase 1)
- Source gathering on Google Scholar
- Reading and note-taking
- RRL paragraph writing
- Synthesis section
- Conceptual framework diagram
3: System Development (Weeks 4-10)
- Sprint 1 through Sprint N if using Agile
- Or Design → Build → Integration phases if Waterfall
- Database design
- UI implementation
- Feature development
- Internal testing
4: Testing and Evaluation (Weeks 9-11)
- System functional testing
- User Acceptance Testing (UAT) preparation
- Respondent recruitment
- UAT deployment and data collection
- Data analysis
5: Documentation Finalization (Weeks 10-12)
- Chapter 4 writing (Results and Discussion)
- Chapter 5 writing (Conclusions and Recommendations)
- References and appendices
- Final document review with adviser
- Defense slide preparation
Notice that Phases 2 and 3 overlap (literature review continues into early development), and Phases 4 and 5 overlap (you write Chapter 4 while UAT is still running).
Real projects always overlap. A Gantt chart that shows perfectly sequential phases is unrealistic and panels know it.
Sample 12-week capstone timeline
This is the standard BSIT capstone timeline in the Philippines.
| Week | Planning | Literature | Development | Testing | Documentation |
|---|---|---|---|---|---|
| 1 | ████████ | ||||
| 2 | ████████ | ████ | |||
| 3 | ████████ | ||||
| 4 | ████████ | ████ | |||
| 5 | ████████ | ||||
| 6 | ████████ | ||||
| 7 | ████████ | ||||
| 8 | ████████ | ||||
| 9 | ████████ | ████ | |||
| 10 | ████ | ████████ | ████ | ||
| 11 | ████████ | ████████ | |||
| 12 | ████ | ████████ |
Key milestones:
- End of Week 2: Proposal defense
- End of Week 4: Chapter 2 draft
- End of Week 8: System functional MVP
- End of Week 10: UAT complete
- End of Week 12: Final defense
Sample 16-week thesis-grade timeline
For thesis-grade work or longer capstone tracks, extend the testing and revision phases.
| Week | Planning | Literature | Development | Testing | Documentation |
|---|---|---|---|---|---|
| 1-2 | ████████ | ||||
| 3-4 | ████████ | ||||
| 5-6 | ████████ | ████ | |||
| 7-10 | ████████ | ||||
| 11-12 | ████████ | ████████ | |||
| 13-14 | ████████ | ████ | |||
| 15 | ████ | ████████ | |||
| 16 | ████████ |
Key milestones:
- End of Week 2: Topic approved
- End of Week 4: Chapter 1 and 2 drafts
- End of Week 6: System design (Chapter 3) finalized
- End of Week 10: System functional
- End of Week 12: UAT complete
- End of Week 15: Full document
- End of Week 16: Final defense
How to build the Gantt chart in 4 tools
Option 1: Microsoft Excel (most common in PH BSIT)
Excel doesn’t have a native Gantt chart, but you can build one with a stacked bar chart in five steps:
- Create three columns: Task Name, Start Date, Duration (days)
- Insert a stacked bar chart using the first three columns
- Click the “Start Date” series and set fill to “No fill” (this makes it invisible)
- Reverse the Y-axis order so tasks appear top-to-bottom
- Format with date X-axis and your brand colors
The template at the end of this post does all five steps for you.
Option 2: Google Sheets (free, collaborative, recommended)
Same approach as Excel. Google Sheets is better if your team works asynchronously because everyone can edit the chart simultaneously. The free template link at the end opens in Google Sheets directly.
Option 3: GanttPRO / Smartsheet / TeamGantt (free trials)
These are dedicated Gantt chart tools with prettier output. They’re useful for thesis-grade work but overkill for a typical 12-week capstone. Most have a 14-day or 30-day free trial: enough to build your chart, export as PDF, and never log in again.
Option 4: Microsoft Project
If your school has a Microsoft 365 Education license, MS Project is included. It’s the most powerful option but has the steepest learning curve. Use only if you’ve used it before.
For 95% of BSIT capstones, the Excel or Google Sheets approach is best.
Sprint-by-sprint structure for Agile capstones
If your Chapter 3 methodology states Agile Scrum (which is most common in BSIT capstones), your Gantt chart should show the sprint structure explicitly.
Standard 6-sprint structure for a 12-week capstone:
| Sprint | Weeks | Focus | Key Deliverables |
|---|---|---|---|
| Sprint 1 | 3-4 | Foundation | Database design, authentication, base UI |
| Sprint 2 | 5-6 | Core features | Main user-facing modules |
| Sprint 3 | 7-8 | Integration | Connecting modules, mid-point review |
| Sprint 4 | 9-10 | Advanced features | Secondary features, reporting |
| Sprint 5 | 10-11 | Polish + UAT | Bug fixes, UAT preparation |
| Sprint 6 | 11-12 | Finalization | Documentation polish, defense prep |
Each sprint includes the standard ceremonies:
- Sprint planning (1 hour, Monday)
- Daily standups (15 min, mornings)
- Sprint review (1 hour, second Friday)
- Sprint retrospective (30 min, second Friday)
Embed this sprint table either as part of your Gantt chart or as a separate Table 3.X in your Chapter 3.
Common mistakes that get the Gantt chart criticized
Eight patterns we’ve seen kill Gantt chart sections across hundreds of defenses:
- No actual dates, just generic week numbers. “Week 1, Week 2, Week 3” looks unprofessional. Use real dates: “Aug 5-9”, “Aug 12-16”.
- Phases don’t overlap at all. Real projects always overlap. A chart with perfectly sequential phases looks fake.
- No milestones marked. Diamonds or stars on key dates (proposal defense, MVP, UAT, final defense) make the chart scannable. A chart without milestones is just colored bars.
- Sprint count doesn’t match Chapter 3.5. If your methodology says 6 sprints, your Gantt must show 6 sprints. Period.
- Team member assignments missing. Adding a small “owner” column showing who led each task signals project management maturity. Especially impressive for thesis-grade work.
- Defense prep not allocated time. Many students forget to plan time for defense rehearsals. A chart that shows “Week 12: Defense” without prep time looks rushed.
- Chart isn’t readable when printed. Print your Gantt chart on letter paper before submitting. If text is unreadable, simplify or split across pages.
- Chart doesn’t match what you actually did. If the panel asks “did you really finish Sprint 3 by Week 8?” and the answer is no, your Gantt chart is wrong. Be honest. Use the actual timeline, not the original plan.
What panels actually look for in your Gantt chart
Three things, in order:
“Did you plan your project at all?” The existence of a Gantt chart answers yes. The quality of the chart answers “how seriously did you plan?”
“Did you actually follow this timeline?” This is the test question. Be honest in defense. If you fell behind in Week 7, say so. “Our Gantt chart was the original plan. We fell two weeks behind during Sprint 3 due to a dependency issue with the payment API.
We recovered by extending Sprint 4 and reducing scope in Sprint 5. The chart in our final documentation reflects the actual timeline.”
“How would you adjust the schedule if you started over?” Have a one-sentence answer ready. “I would allocate two more weeks for testing because UAT recruitment took longer than expected.”
Panels reward honest project management over fictional perfection.
Quick reference: Gantt chart checklist
Use this before submitting your Gantt chart with your documentation:
- [ ] Real dates on the X-axis, not generic week numbers
- [ ] At least 5 phases shown
- [ ] Phases overlap where appropriate (literature review during planning, documentation during testing)
- [ ] Sprint structure matches Chapter 3.5 exactly
- [ ] Milestones marked clearly (proposal defense, MVP, UAT, final defense)
- [ ] Team member assignments included (if your school requires)
- [ ] Defense rehearsal time allocated in final week
- [ ] Chart fits on one printed page (or 2 max)
- [ ] All text readable when printed at 100%
- [ ] Filename includes your project title for adviser tracking
If you can check all 10 items, your Gantt chart is ready for Appendix B.
How long should the Gantt chart take to make
Allocate 2-4 hours total:
- 30 minutes: phase and task list brainstorm
- 1 hour: building the chart in your tool of choice
- 30 minutes: formatting, colors, milestones
- 30 minutes: adviser review and adjustments
- 30 minutes: finalizing and exporting to PDF
If you’re spending more than 4 hours, you’re over-engineering. Use the template at the end of this post and adapt. Do not build from scratch.
Frequently Asked Questions
Do I need a Gantt chart for my capstone project?
What software is best for creating a capstone Gantt chart?
How long should a capstone Gantt chart timeline be?
Should my Gantt chart show actual or planned timelines?
Where does the Gantt chart go in my capstone documentation?
Official references
Frequently Asked Questions
Do I need a Gantt chart for my capstone project?
Yes, a Gantt chart is required for almost all BSIT and IT capstone projects in the Philippines and India. It is typically included as Appendix B in your documentation and referenced in Chapter 3 Section 3.5 (Software Development Methodology). The Gantt chart demonstrates that you planned your project across the development timeline and helps your panel verify that your methodology section reflects an actual workable schedule. Even capstones using non-Agile methodologies like Waterfall require a Gantt chart showing the phases of development.
What software is best for creating a capstone Gantt chart?
For most BSIT capstones, Microsoft Excel or Google Sheets are the best choices. Both produce professional Gantt charts using a stacked bar chart approach, both are free for students (Excel through Microsoft 365 Education, Google Sheets through any Google account), and both produce print-ready output. For thesis-grade work, dedicated tools like GanttPRO, Smartsheet, or TeamGantt offer more features and prettier output but require free trial accounts. Avoid building Gantt charts in PowerPoint or Word, the result almost always looks unprofessional.
How long should a capstone Gantt chart timeline be?
A typical BSIT capstone Gantt chart covers 12 to 16 weeks, matching the standard duration of a capstone or thesis course. The 12-week timeline is most common for undergraduate BSIT capstones in the Philippines, while 16-week timelines are used for thesis-grade work or schools with longer capstone tracks. Within those weeks, allocate roughly 2 weeks to planning, 2 to 3 weeks to literature review with overlap, 6 to 8 weeks to system development, 2 to 3 weeks to testing and UAT, and 2 to 3 weeks to documentation finalization.
Should my Gantt chart show actual or planned timelines?
Your final submitted Gantt chart should show the actual timeline of what you did, not the original plan from week 1. Panels will compare your Gantt chart against the milestones you describe in Chapter 4. If the chart shows Sprint 3 ending in Week 6 but your actual Sprint 3 ran until Week 8, the inconsistency will be flagged. Update the chart at the end of your project to reflect what actually happened. Honest delays with a recovery story are more defensible than a fictional perfect schedule.
Where does the Gantt chart go in my capstone documentation?
The Gantt chart appears in two places in your capstone documentation. First, it is referenced in Chapter 3 Section 3.5 (Software Development Methodology) with a sentence like Figure 3.1 shows the Gantt chart of the development phases, included as Appendix B. The chart itself is not embedded in the chapter body. Second, the full-size Gantt chart is included as Appendix B in the back matter of your documentation, typically between Appendix A (Source Code) and Appendix C (Questionnaire). Some schools use different appendix lettering, check your school documentation manual.
Plan Smart. Track Progress. Defend with Confidence
A clean gantt chart capstone project isn’t fancy. It’s just five phases, real dates, marked milestones, and honest timing. Two hours of work for a chart panels actually respect.
For the full Chapter 3 methodology that your Gantt chart supports, see our Chapter 3 Methodology guide. For the broader Chapter 1-5 structure, see our Capstone Chapter 1-5 Template.
Moreover for defense questions panels ask about your timeline and sprint structure, see our 50 Common Capstone Defense Questions.
If you haven’t picked your capstone topic yet, browse 150 Best Capstone Project Ideas for IT Students 2026. For source code to reference in your timeline planning, see our Python projects library and free projects library.
Now open the template. Set your start date. Drag the bars to match your sprints. Print it. Drop it in Appendix B.
Done in 2 hours. Defense-ready forever.

Caren Bautista
Technical Writer at PIES IT Solution
Responsible for crafting clear, well-structured, and beginner-friendly content across the platform. Handles the writing, proofreading, and editorial review of tutorials, guides, and documentation to ensure every article is accurate, readable, and easy to follow.
Expertise: Technical Writing · Content Creation · Documentation · Editorial Writing · JavaScript · TypeScript · Python · Python Errors · HTTP Errors · MS Excel · View all posts by Caren Bautista →