Activity Diagram for Ecommerce capstones live or die by the checkout flow. Most students draw a simple linear “add to cart → pay → done” diagram that doesn’t reflect any of the real-world branches.
What happens when the cart is empty? What happens when payment fails? And, what happens when stock runs out mid-checkout? Without those branches, your activity diagram doesn’t pass review.
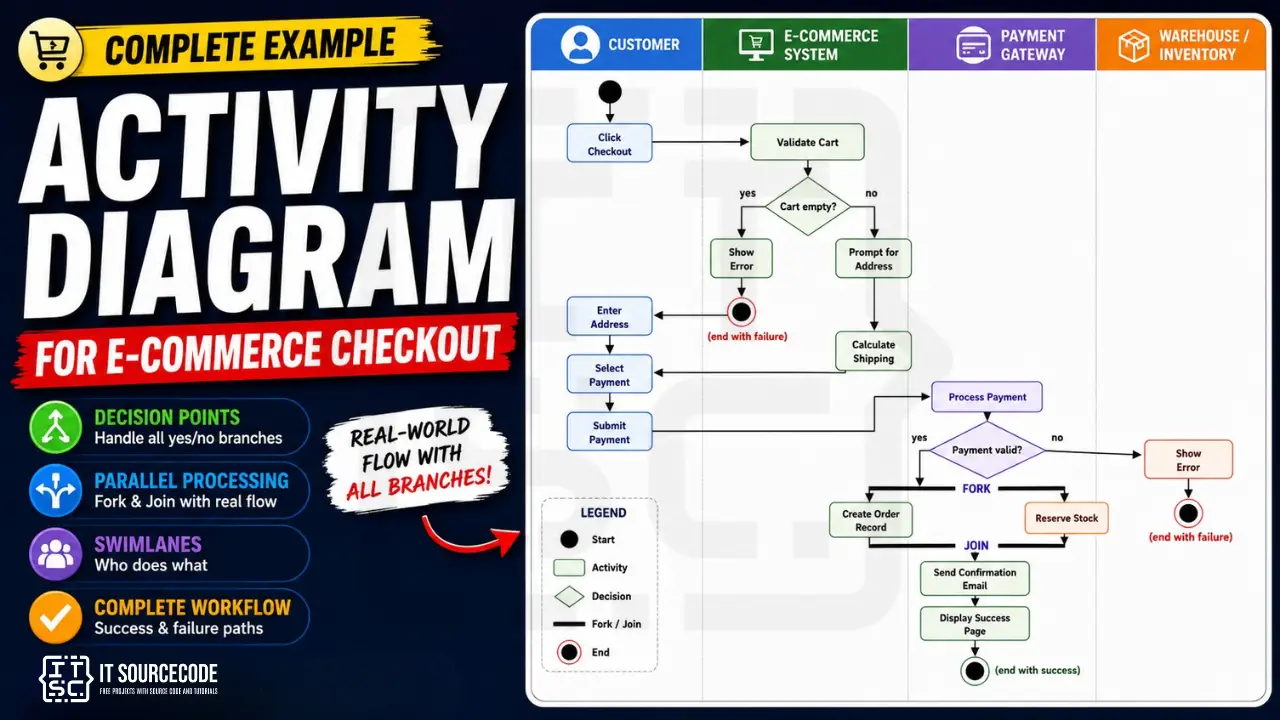
The Activity Diagram is where you prove you thought through every path. This guide walks through the complete activity diagram for e-commerce checkout with decision diamonds, parallel processing (fork/join), and swimlanes showing who does what. Adapt the structure to whatever workflow your capstone needs to model.
This is the last of the major UML diagram types in our cluster. If you’ve already worked through the DFD, Use Case, ER, Class, and Sequence deep-dives, you have everything Chapter 3 needs.
What an activity diagram actually shows
An Activity Diagram shows the FLOW of activities in a process. Five things it captures:
- Start and end states: where the process begins and ends
- Activities: the work being done
- Decision points: if/else branches
- Parallel paths: activities that happen simultaneously
- Responsibility: who does what (with swimlanes)
Activity diagrams live in Chapter 3, Section 3.6 (System Design). They often pair with sequence diagrams for the same workflow, the sequence diagram shows who-talks-to-who in time order; the activity diagram shows the overall flow with branches.
For the general activity diagram guide covering all UML conventions, see our Activity Diagram guide. This post applies those conventions to an e-commerce checkout worked example.
Activity diagram vs flowchart vs sequence diagram
Three similar-looking diagrams that get confused. Pick the right one for your purpose.
| Diagram | Shows | Use For |
|---|---|---|
| Flowchart | Simple procedural flow without swimlanes | Algorithms, decision logic |
| Activity Diagram | Workflow with swimlanes, parallel execution, UML notation | Business processes, system workflows |
| Sequence Diagram | Time-ordered messages between specific participants | Who-talks-to-who interactions |
Activity diagrams sit between flowcharts (too simple, no UML, no concurrency) and sequence diagrams (too participant-focused). For most BSIT capstone workflows, the activity diagram is the right choice.
When in doubt: if your workflow has multiple actors AND decision branches AND possibly parallel activities, draw an activity diagram. If your workflow has only decision branches and one actor, a flowchart suffices.
The 8 elements of every activity diagram
Eight building blocks. Memorize these.
1. Initial node (filled black circle)
Where the flow starts. Every activity diagram has exactly ONE initial node.
● (single filled black circle)
2. Activity / Action (rounded rectangle)
A step in the process, the actual work being done. Named with a verb phrase: “Validate Cart,” “Process Payment,” “Send Confirmation.”
┌────────────────┐
│ Validate Cart  │
└────────────────┘
3. Control flow (arrow)
A directed arrow connecting activities. Shows the order in which activities execute.
────────►
4. Decision node (diamond)
A branch point with one input and multiple outputs. Each output arrow is labeled with the condition under which it’s taken.
        ◆
       / \
      /   \
    yes    no
5. Merge node (diamond going opposite way)
A diamond with multiple inputs and one output. Used to bring branches back together.
        ◆
       / \
      /   \
   (in)   (in)
      \   /
       \ /
        ▼
       out
Don’t confuse merge with decision. Decision splits flow; merge combines flow without making a choice.
6. Fork (thick horizontal bar splitting)
One input flow, multiple output flows that run IN PARALLEL.
   ▼
━━━━━━━━━━━━━━  (fork bar)
 │    │    │
 ▼    ▼    ▼
7. Join (thick horizontal bar merging)
Multiple input flows, one output flow. Waits for ALL inputs to complete before continuing.
 │    │    │
 ▼    ▼    ▼
━━━━━━━━━━━━━━  (join bar)
   │
   ▼
Fork and join are usually paired, fork splits, join recombines.
8. Final node (circle with X inside or filled circle)
Where the flow ends. An activity diagram can have multiple final nodes (different end states).
⦿ (circle with filled center)
Swimlanes: who does what
A swimlane is a vertical column representing an actor or responsibility area. Activities placed in a swimlane are performed by that actor.
For e-commerce checkout, typical swimlanes:
- Customer: the user clicking through the checkout
- E-commerce System: the backend handling cart and orders
- Payment Gateway: external service like PayMaya, GCash, Stripe
- Warehouse / Inventory: backend handling stock and fulfillment
Without swimlanes, your activity diagram shows “what happens” but not “who does it.” Panels look for swimlanes in capstone activity diagrams. Skipping them is a common reason the chapter gets sent back.
E-Commerce Checkout: the example context
For this guide, we model a complete e-commerce checkout flow from “click checkout” to “order confirmed.”
Swimlanes (4)
| Swimlane | Activities |
|---|---|
| Customer | Click checkout, enter address, select payment, submit payment |
| E-commerce System | Validate cart, calculate shipping, create order, send confirmation |
| Payment Gateway | Process payment, return result |
| Warehouse | Reserve stock |
Major activities (12)
- Click Checkout
- Validate Cart Not Empty
- Enter Shipping Address
- Calculate Shipping Cost
- Select Payment Method
- Submit Payment
- Process Payment (external)
- Create Order Record (parallel)
- Reserve Stock (parallel)
- Send Confirmation Email
- Display Success Page
- Show Error (alternative path)
Decision points (2 critical)
- Is the cart empty? (after validate)
- Is the payment valid? (after process payment)
Fork/Join section
After successful payment, two activities run in parallel:
- Create Order Record (E-commerce System)
- Reserve Stock (Warehouse)
After both complete (join), proceed to send confirmation.
The complete activity diagram
Here’s the complete representation of activity diagram with swimlanes:
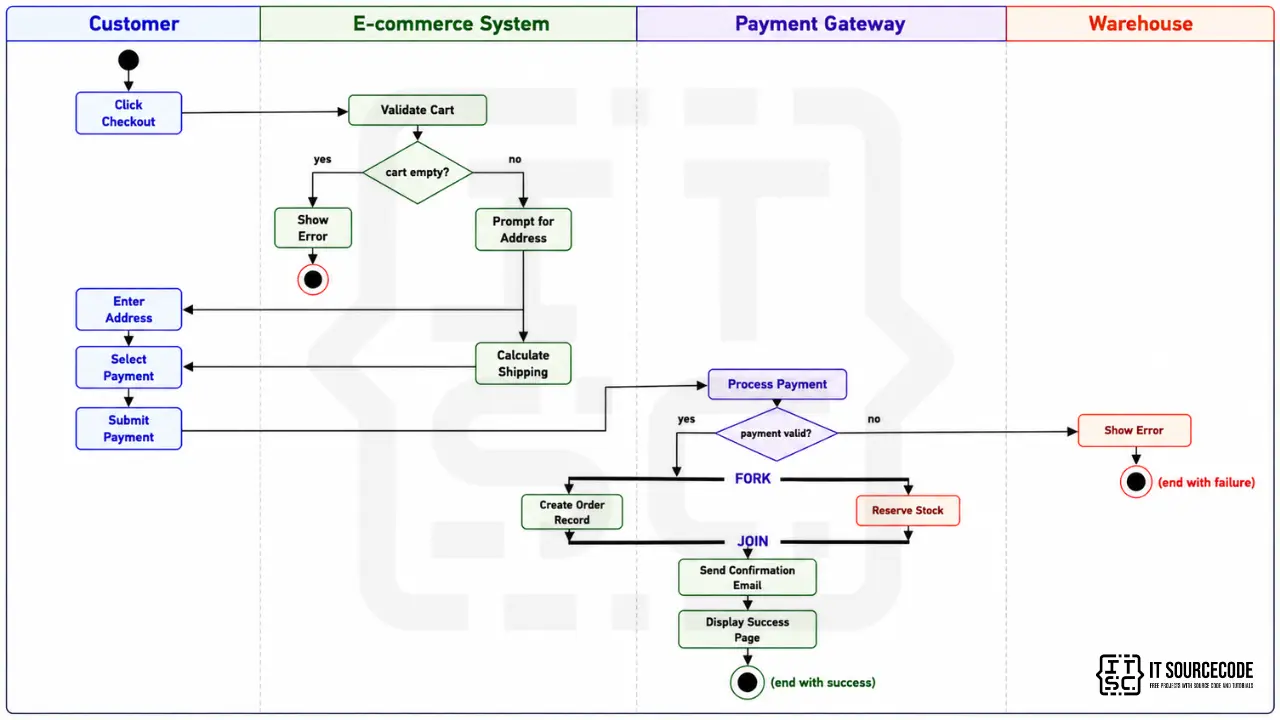
Key things to notice:
- Flow starts in the Customer swimlane (top left)
- Each activity sits in the swimlane of the actor performing it
- Two decision diamonds: “cart empty?” and “payment valid?”
- One fork/join section after successful payment
- Two final nodes: one for failure, one for success
- Cross-swimlane arrows show handoffs between actors
Every activity explained
Click Checkout (Customer): Customer initiates checkout from the cart page. Entry point of the workflow.
Validate Cart Not Empty (System): Backend checks that the cart contains at least one item. Critical because direct URL access could trigger checkout with an empty cart.
Decision: Cart empty?: Yes → Show error and return to cart. No → Proceed to address entry.
Enter Shipping Address (Customer): Customer provides delivery address, including special instructions if any.
Calculate Shipping Cost (System): Based on the address and cart contents, system computes shipping fee using rules (distance, weight, expedited options).
Select Payment Method (Customer): Customer chooses GCash, credit card, COD, etc.
Submit Payment (Customer): Customer confirms and submits payment details.
Process Payment (Payment Gateway): External service validates the payment, charges the customer’s account, and returns a result.
Decision: Payment valid?: Yes → Fork into parallel order creation and stock reservation. No → Show payment error.
Create Order Record (System): Backend saves the order in the database with status “Confirmed.” Generates order number.
Reserve Stock (Warehouse): Backend warehouse system decrements available inventory for ordered items. Marks items as “Reserved” until shipped.
Join (after both parallel activities complete): System waits for both Create Order AND Reserve Stock to finish before proceeding.
Send Confirmation Email (System): System emails the customer with order details, tracking info, and estimated delivery.
Display Success Page (System): Customer sees the confirmation page in their browser.
Decision points explained
Two critical decision diamonds in this workflow:
Decision 1: Cart empty?
- Yes → Loop back to cart page with error message
- No → Continue to shipping address
This protects against URL manipulation and edge cases like items expiring in the cart.
Decision 2: Payment valid?
- Yes → Fork into parallel order/stock processing
- No → Show payment error, allow retry
This is where most real e-commerce failures happen. Network issues, insufficient funds, card declined, fraud detection, all surface here. Your diagram must handle the “no” branch.
Optional enhancement: Decision 3, Stock available? After reserve stock, check that all items were successfully reserved. If not, cancel the order, refund the payment, notify the customer.
Fork and Join: parallel processing
After successful payment, two activities happen simultaneously:
- Create Order Record in the database (E-commerce System swimlane)
- Reserve Stock in the warehouse (Warehouse swimlane)
These don’t depend on each other. Saving the order doesn’t require waiting for stock reservation, and vice versa. Running them in parallel makes checkout faster.
The fork bar (thick horizontal line) splits the flow into two. Both parallel activities run independently. The join bar (another thick horizontal line) waits for both to complete before allowing the flow to continue.
Without the join, you might send a confirmation email before stock is reserved, and then realize the item was actually out of stock. The join prevents this.
This pattern (fork + parallel work + join) appears in many e-commerce, banking, and order-processing workflows. Learning to draw it correctly is one of the higher-skill activity diagram patterns panels reward.
From activity diagram to Java code
Sample Java implementation showing how the diagram maps to code:
public CheckoutResult checkout(Cart cart, Address address, PaymentInfo payment) {
    // Activity: Validate cart
    if (cart.isEmpty()) {
        return CheckoutResult.fail("Cart is empty");
    }

    // Activity: Calculate shipping cost
    double shippingCost = shippingService.calculate(cart, address);
    double totalAmount = cart.getTotal() + shippingCost;

    // Activity: Process payment (external)
    PaymentResult paymentResult = paymentGateway.process(payment, totalAmount);

    // Decision: Payment valid?
    if (!paymentResult.isSuccess()) {
        return CheckoutResult.fail("Payment failed: " + paymentResult.getError());
    }

    // Fork: parallel order creation + stock reservation
    CompletableFuture<Order> orderFuture = CompletableFuture.supplyAsync(() ->
        orderService.createOrder(cart, address, paymentResult)
    );
    CompletableFuture<Void> stockFuture = CompletableFuture.runAsync(() ->
        warehouseService.reserveStock(cart.getItems())
    );

    // Join: wait for both to complete
    CompletableFuture.allOf(orderFuture, stockFuture).join();
    Order order = orderFuture.join();

    // Activity: Send confirmation email
    notificationService.sendOrderConfirmation(order);

    // Activity: Return success (drives Display Success Page in UI)
    return CheckoutResult.success(order);
}
The decision diamond becomes an if/else. The fork becomes parallel CompletableFuture calls. The join becomes CompletableFuture.allOf().join(). The activities become method calls. The final node maps to the return value.
Common activity diagram mistakes that get sent back
Eight patterns we see in BSIT defenses:
- No initial or final node. Every activity diagram needs ONE initial node (filled circle) and at least one final node (circle with X). Without them, the reader doesn’t know where the flow starts or ends.
- Missing decision diamond labels. Every diamond needs the condition (in the diamond) AND yes/no labels on the outgoing arrows. Unlabeled decisions are the #1 mistake.
- Fork without join. Parallel flows must eventually rejoin (or end separately at multiple final nodes). A fork that doesn’t rejoin leaves the diagram structurally broken.
- Activities without swimlanes. Without swimlanes, you lose the “who does what” dimension. Panels notice immediately.
- Using activity diagram where sequence diagram fits better. If your workflow is dominated by message exchanges between specific participants, draw a sequence diagram. Activity diagrams excel at flow with branching.
- Too many activities in one diagram. Above 15 activities, the diagram becomes unreadable. Split into multiple activity diagrams or summarize at a higher level.
- Mixing detail levels. Don’t put “User clicks login button” (UI-level) and “Validate credentials in database” (system-level) in the same diagram. Pick one detail level and stick to it.
- No clear main flow. If your diagram has decision branches everywhere with no obvious “happy path” from start to end, the reader gets lost. Always draw the main success flow first, then add error branches.
How to draw your activity diagram: tool recommendations
draw.io (free, recommended)
- Built-in activity diagram shapes
- Swimlane layouts work well
- Export to PNG, PDF, SVG
Lucidchart (free tier)
- Activity diagram templates
- Real-time collaboration
PlantUML (free, text-based)
- Activity diagrams supported, though less elegant than sequence diagrams
- Best for version control
StarUML
- Dedicated UML tool
- Better swimlane support than draw.io
What to avoid: PowerPoint, Word. Activity diagrams with swimlanes need precise alignment that’s hard to achieve manually.
How to put your activity diagram in Chapter 3
Same placement as other UML diagrams: Chapter 3, Section 3.6, with figure number, caption, and explanation paragraph.
Caption format:
Figure 3.X. Activity Diagram for [Workflow Name] of the [Your System Name].
The explanation paragraph should:
- Name the workflow this diagram represents
- List the swimlanes (actors involved)
- Highlight key decision points and what they branch on
- Note any fork/join sections and why parallel execution makes sense
- Reference the corresponding sequence diagram if you have one for the same workflow
For the full Chapter 3 methodology, see our Chapter 3 Methodology guide.
How to customize for your specific system
Different domains have different signature workflows. Adapt the structure:
- E-commerce checkout (the default in this guide)
- Restaurant order flow: add Kitchen swimlane, prep time decisions
- Hospital admission: Patient → Triage → Registration → Bed Assignment → Admission
- Loan application: Applicant → Document Review → Credit Check → Approval → Disbursement
- Course enrollment: Student → Prerequisite Check → Seat Availability → Payment → Confirmation
- Job application: Applicant → Initial Screening → Interview → Background Check → Offer
- Insurance claim: Claimant → Document Upload → Adjuster Review → Assessment → Payout
- Library book return: Patron → Return → Condition Check → Fine Calculation → Record Update
For each, identify 4-5 swimlanes, 8-15 activities, and 2-3 decision points. That’s enough complexity for a defense-grade activity diagram.
Free download: activity diagram template
Official documentation
Working source code for this system
Download the actual implementation of this system in your preferred language. Each project includes source code, database, and setup instructions for BSIT capstone use.
Frequently Asked Questions
What is an activity diagram and how is it different from a flowchart?
When should I use an activity diagram in my capstone?
What is a swimlane in an activity diagram?
What is the difference between fork and decision in an activity diagram?
How many activities should be in an activity diagram?
Pick the workflow. Draw the swimlanes. Add the decision points.
Activity diagrams start with the workflow you want to model. Pick the workflow with the most branches, the most actors, and the most defense-worthy complexity. That’s where your activity diagram earns its place in Chapter 3.
Draw the swimlanes first (4 is typical). List the activities. Place each in the right swimlane. Add the decision diamonds for branches. Add the fork/join if parallel work happens.
By the time you have 4 swimlanes, 12 activities, 2-3 decision points, and one fork/join section, you have a defensible activity diagram.
For the full Chapter 3 methodology, see our Chapter 3 Methodology guide. For the broader documentation structure, see our Capstone Chapter 1-5 Template. And for sibling UML deep-dives, see our Sequence Diagram for Online Banking System, Class Diagram for Library Management System, ER Diagram for Hospital Management System, and DFD for Inventory Management System.
For other UML diagram types, see our UML guides hub. If you haven’t picked your capstone topic yet, browse 150 Best Capstone Project Ideas for IT Students. For working e-commerce source code to study, search our free projects library.
Now open draw.io. Add 4 swimlanes. Drop 12 activities. Connect them with arrows. Add 2 decision diamonds.
Activity diagram done. Chapter 3 complete.

Caren Bautista
Technical Writer at PIES IT Solution
Responsible for crafting clear, well-structured, and beginner-friendly content across the platform. Handles the writing, proofreading, and editorial review of tutorials, guides, and documentation to ensure every article is accurate, readable, and easy to follow.
Expertise: Technical Writing · Content Creation · Documentation · Editorial Writing · JavaScript · TypeScript · Python · Python Errors · HTTP Errors · MS Excel · View all posts by Caren Bautista →