
CrashLoopBackOff is the most-searched Kubernetes error for a reason. It shows up when a pod starts, crashes, restarts, crashes again, and Kubernetes decides to wait longer between restart attempts to avoid burning cluster resources. The “BackOff” part is Kubernetes protecting itself; the crash part is your application, config, or infrastructure.
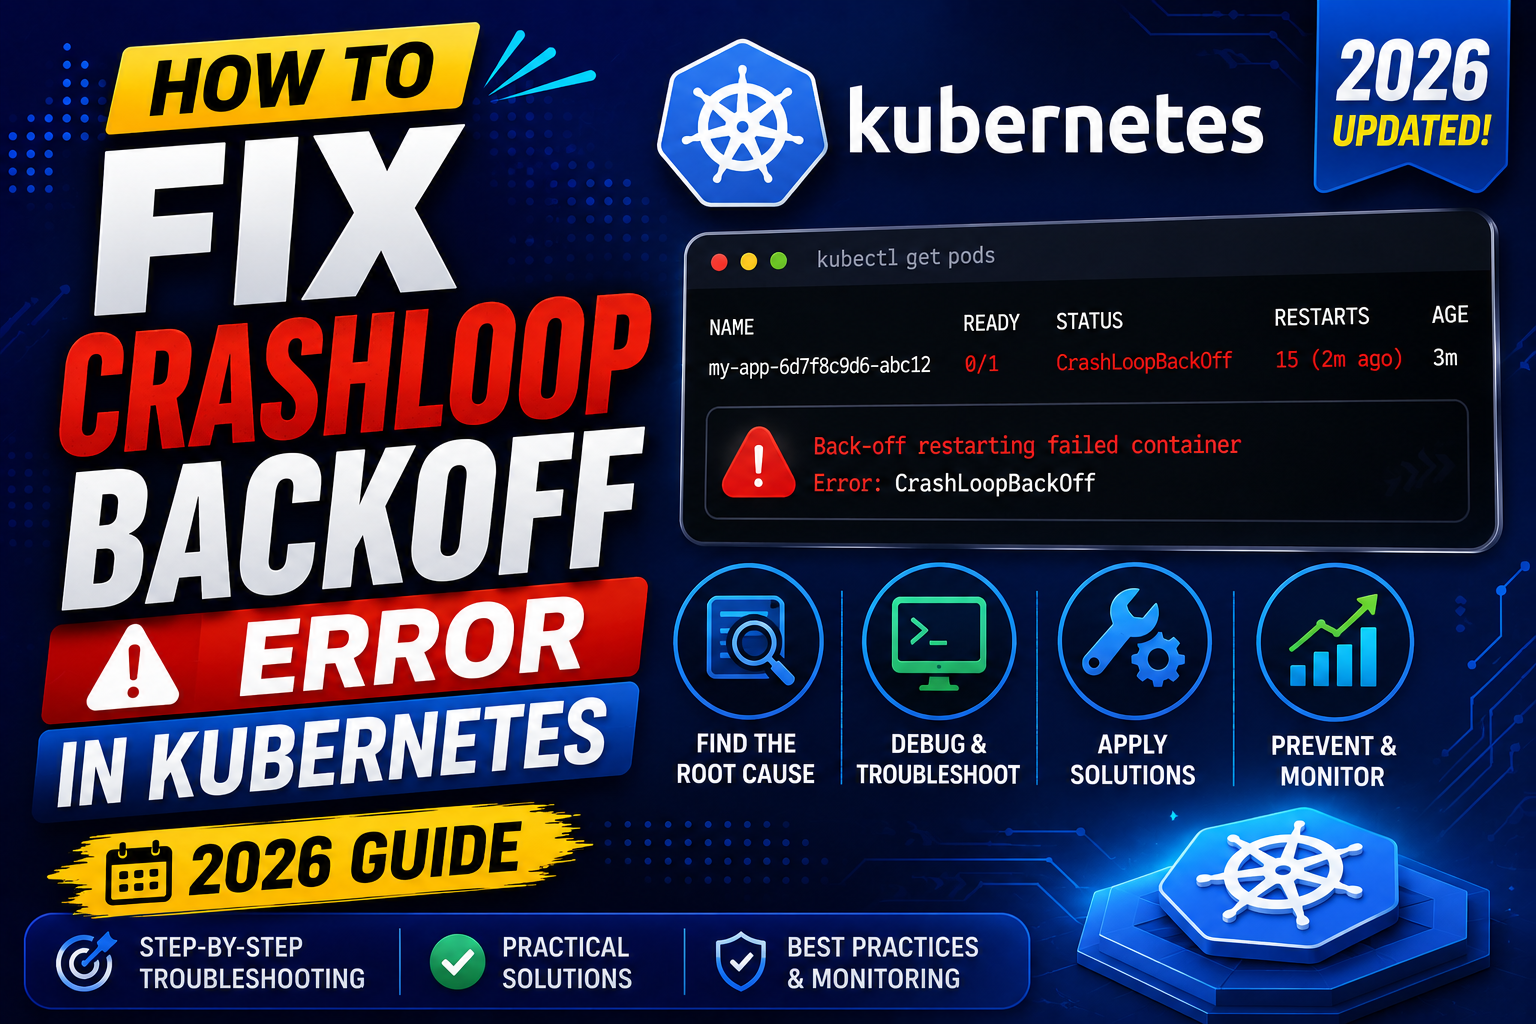
We collected the 6 most common root causes and the exact kubectl commands to diagnose and fix each. Work through them in order. Most CrashLoopBackOff cases resolve in the first two or three fixes without needing to redeploy from scratch.
Quick step-by-step summary (click to expand)
- Get the pod status. Run kubectl describe pod POD_NAME to see the exit code, restart count, and last event log.
- Read the crash logs. Use kubectl logs POD_NAME –previous to see stderr from the last crashed instance before Kubernetes restarted.
- Check for image or command errors. Look for ImagePullBackOff, ExitCode 127 (command not found), or Exit Code 1 (application error).
- Verify liveness and readiness probes. A misconfigured probe kills pods that are actually healthy.
- Check resource limits. OOMKilled (Exit Code 137) means the pod hit its memory limit and Linux killed it.
- Verify env vars and secrets. Missing environment variables or malformed ConfigMap entries crash the app on startup.
What CrashLoopBackOff actually means
When Kubernetes starts a pod, it expects the container process to keep running. If the process exits within seconds, Kubernetes restarts it. If it exits again, Kubernetes restarts it. After ~3 restarts in a short window, the scheduler switches to exponential backoff: waits 10 seconds, then 20, then 40, then 80, then up to 5 minutes between restart attempts.
The “CrashLoopBackOff” status is Kubernetes telling you: “I have tried to restart this pod several times, it keeps crashing, and I am now spacing out my attempts so I do not thrash the node.” The underlying cause is always inside the container itself. Kubernetes is just reporting what it observed.
Before touching anything, check the exit code:
kubectl describe pod POD_NAME | grep -A5 "Last State"
The exit code narrows the diagnosis before you even look at logs:
- Exit Code 0: the process finished cleanly (but Kubernetes expected it to run forever). Your app is exiting without an error.
- Exit Code 1: generic application error. Check the app logs.
- Exit Code 127: command not found. Check your Dockerfile ENTRYPOINT or your pod command field.
- Exit Code 137: OOMKilled. Kernel killed the process because it exceeded memory limits.
- Exit Code 139: segmentation fault. Application crashed hard.
- Exit Code 143: received SIGTERM and did not clean up in time.
Fix 1: Read the crash logs
The single most useful command for CrashLoopBackOff:
kubectl logs POD_NAME --previous
The –previous flag is critical. Without it, you get logs from the current instance (which usually has not started or has already crashed empty). With –previous, you get stderr from the crashed instance before Kubernetes restarted it. This is where 80 percent of CrashLoopBackOff cases reveal themselves.
Common patterns to look for in the output:
- Stack trace with a specific line number: your application code has a bug or missing dependency. Fix the code, rebuild the image, redeploy.
- “Cannot connect to database”: the app crashes because DATABASE_URL is unreachable or wrong.
- “env var X is required”: missing environment variable or Secret binding.
- “Permission denied” opening a file: volume mount permission issue or wrong container user.
- Empty log output: app exits before writing anything. Usually an ENTRYPOINT or command-line arg issue (see Fix 3).
Fix 2: Check the liveness and readiness probes
Liveness probes tell Kubernetes when to restart a container. Readiness probes tell it when to send traffic. Misconfigured probes cause CrashLoopBackOff on pods that are actually working.
The classic mistake: setting a liveness probe with a 5-second initialDelaySeconds on an app that takes 30 seconds to boot. Kubernetes checks at 5 seconds, gets no response, kills the container, restarts, checks again at 5 seconds, kills again. CrashLoopBackOff, but the app is fine.
Check your probe config with:
kubectl get pod POD_NAME -o yaml | grep -A10 "livenessProbe\|readinessProbe"
Safe defaults for most apps:
livenessProbe:
  httpGet:
    path: /healthz
    port: 8080
  initialDelaySeconds: 30
  periodSeconds: 10
  failureThreshold: 3
  timeoutSeconds: 5
initialDelaySeconds of 30 gives most apps time to boot before the first check. Reduce only if you know your app starts faster.
Fix 3: Verify the container command and image
Exit Code 127 (command not found) means your ENTRYPOINT or command field points to something that does not exist in the container filesystem. Common causes:
- Typo in the command name (npm-start vs npm start)
- Wrong path (/app/start vs /usr/local/bin/start)
- Missing binary (the base image does not include what your ENTRYPOINT expects)
- Wrong image tag (using latest when a specific old version is needed)
Test the image locally without Kubernetes first:
docker run --rm -it YOUR_IMAGE_TAG /bin/sh
# Then manually run your ENTRYPOINT to see it work
which YOUR_COMMAND
If the command works locally but fails in Kubernetes, the difference is usually environment variables or volume mounts (see Fix 6).
Fix 4: Handle OOMKilled (Exit Code 137)
If the exit code is 137, the Linux kernel killed your process because it exceeded the container’s memory limit. This is common with Node.js, Java, and Python apps that gradually leak memory or spike during load.
Check current memory usage right before the crash:
kubectl top pod POD_NAME
# Compare to your resource limits:
kubectl get pod POD_NAME -o yaml | grep -A3 resources
Fixes, in order of preference:
- Raise the memory limit if the app genuinely needs more (increase limits.memory from 256Mi to 512Mi and see if it stabilizes)
- Set Java heap explicitly via -Xmx flag matching your container limit minus overhead
- Enable Node.js –max-old-space-size to match the container limit
- Profile for memory leaks if usage keeps climbing over hours despite steady load (heap dumps in Java, –inspect in Node.js)
Fix 5: Verify environment variables and secrets
Apps that need environment variables crash immediately if they are missing. If your logs show “DATABASE_URL is required” or similar, verify the ConfigMap or Secret is mounted correctly:
kubectl get configmap MY_CONFIG -o yaml
kubectl get secret MY_SECRET -o yaml
kubectl exec POD_NAME -- printenv | grep DATABASE_URL
Common issues:
- ConfigMap or Secret does not exist in the same namespace as the pod
- Key name mismatch (deployment references DATABASE_URL but ConfigMap has database-url)
- Secret value is base64-encoded incorrectly (add a trailing newline by mistake, common with echo instead of printf)
- envFrom is missing so no env vars get injected at all
Fix 6: Debug interactively before redeploying
If none of the above fixes it and the pod crashes too fast to inspect, override the ENTRYPOINT to open a shell instead:
kubectl run debug-POD_NAME --rm -it --image=YOUR_IMAGE \
  --command -- /bin/sh
This starts a fresh pod with your image but a shell instead of the app command. From inside the shell, run your ENTRYPOINT manually and watch what happens. Missing dependencies, permission errors, and config bugs surface immediately.
Alternative: use kubectl debug to attach an ephemeral debug container to the crashing pod without disturbing it:
kubectl debug POD_NAME -it --image=busybox --target=CONTAINER_NAME
This works even when the target pod is stuck in CrashLoopBackOff, since the debug container shares the pod’s network and file system.
How to prevent CrashLoopBackOff in the future
- Always set explicit resource requests and limits (never rely on cluster defaults)
- Set liveness probe initialDelaySeconds at least equal to your app’s slowest cold-boot time
- Health-check endpoints (/healthz) should return 200 only when the app is truly ready to serve traffic
- Validate ConfigMap and Secret existence in CI before deploying manifests
- Use graceful shutdown handlers so SIGTERM does not leave your app in a broken state
- Run kubectl logs –previous immediately after deploying anything new, before assuming success
Official documentation
Try the tools
The links below are affiliate links. We may earn a commission at no extra cost to you. Read our affiliate disclosure.
- OnSpace AI for building AI-powered apps and prototypes without wrestling with raw Kubernetes SDK calls yourself.
- Thunderbit for extracting structured data from any webpage using AI, useful when feeding real-world data into your AI pipeline.
Frequently asked questions
Why does kubectl logs return nothing for a crashing pod?
Without the –previous flag, kubectl logs shows the current pod instance, which either has not started or crashed before writing any output. Always run kubectl logs POD_NAME –previous when investigating CrashLoopBackOff. That returns the stderr from the crashed instance before Kubernetes restarted it.
Is CrashLoopBackOff the same as ImagePullBackOff?
No. ImagePullBackOff means Kubernetes cannot download the container image (wrong tag, private registry, credential issue). CrashLoopBackOff means the image downloaded fine but the container process is crashing after it starts. The fixes are completely different, so check the exact status message before diagnosing.
How long will Kubernetes keep retrying a CrashLoopBackOff pod?
Indefinitely, but with exponential backoff up to 5 minutes between attempts. Kubernetes never gives up on a CrashLoopBackOff pod unless you delete the deployment or the pod explicitly. This is why you should fix the root cause rather than waiting for it to resolve on its own.
What is a safe initialDelaySeconds for liveness probes?
30 seconds is a safe default for most web applications. For heavy Java or Python apps with large dependencies to load, use 60 seconds. Measure your app’s cold-boot time locally and set initialDelaySeconds to at least that value plus 10 seconds of headroom.
How do I fix OOMKilled without raising the memory limit?
Two options: reduce actual app memory usage (profile for leaks, reduce cached data, add pagination), or split the workload across more pod replicas so each one processes less. Raising the memory limit is simplest but not always the right long-term fix.
Can I debug a CrashLoopBackOff pod without deleting it?
Yes. Use kubectl debug POD_NAME -it –image=busybox –target=CONTAINER_NAME to attach an ephemeral debug container to the running pod. It shares network and filesystem with the crashing container without disturbing it. This is the safest way to investigate production incidents.
CrashLoopBackOff is Kubernetes doing its job. The signal is telling you that your pod cannot stay running, and the exit code plus the crash logs will tell you why in 90 percent of cases. Start with kubectl logs –previous, work through the exit code table, and only reach for kubectl debug when the standard flow leaves you stuck.

Adones Evangelista
Programmer & Technical Writer at PIES IT Solution
Adones Evangelista is a programmer and writer at PIES IT Solution, author of over 900 tutorials and error-fix guides at itsourcecode.com.
Expertise: JavaScript · Python · Django · Laravel · Error Debugging · C/C++ · View all posts by Adones Evangelista →