
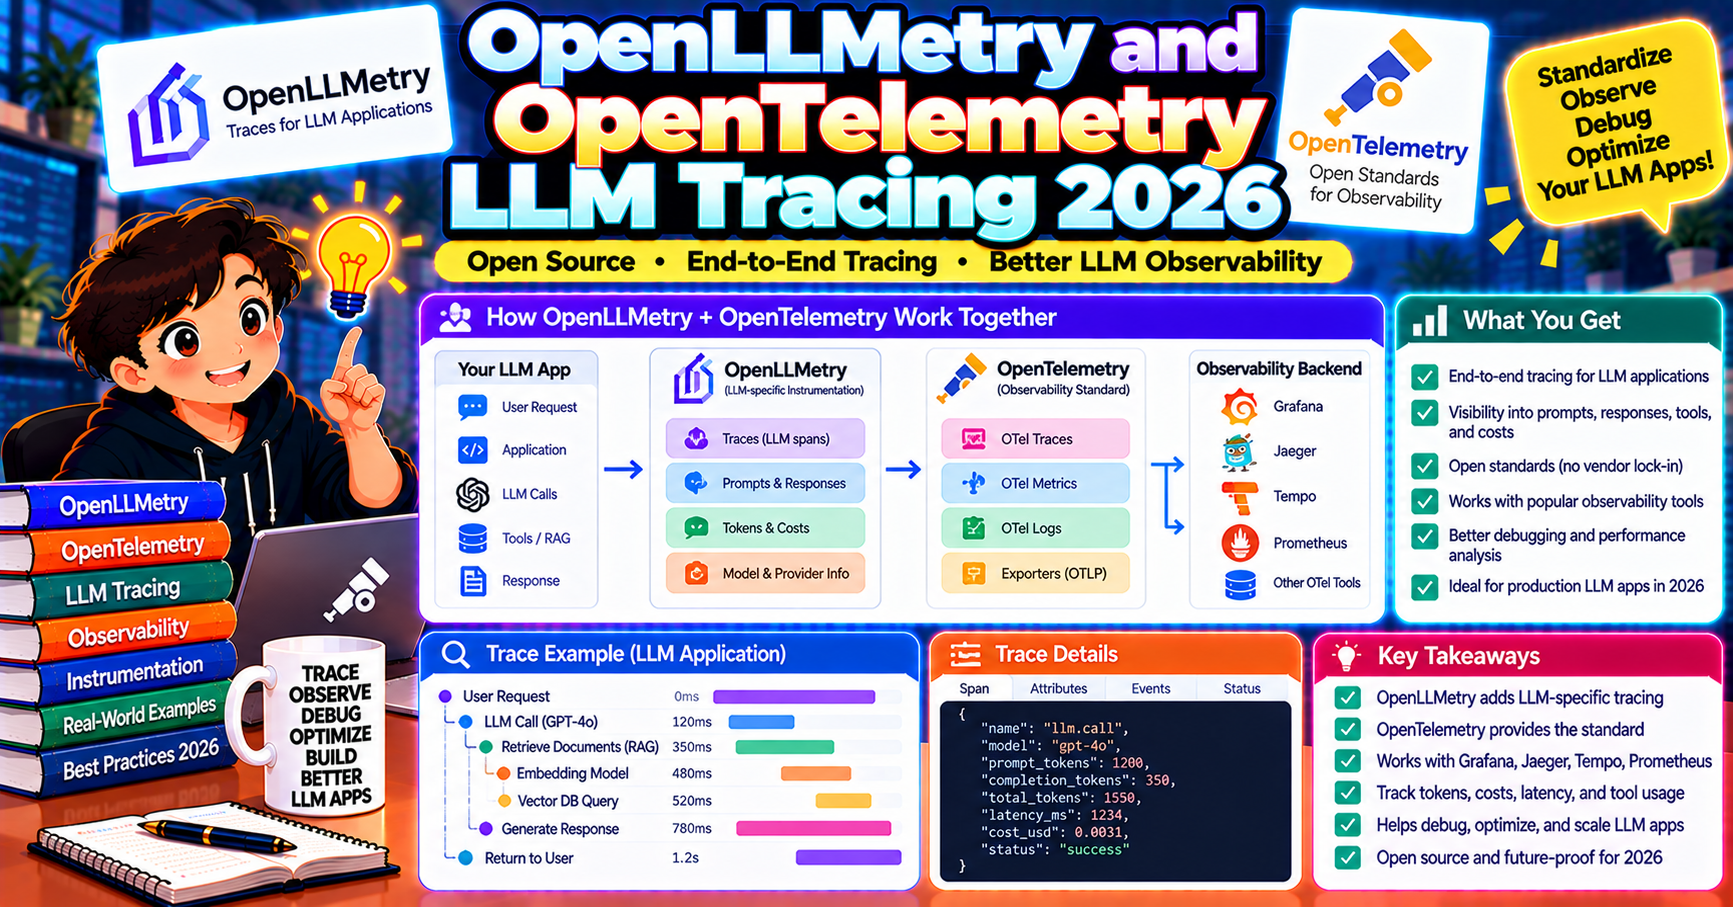
OpenTelemetry is the industry-standard observability framework for traditional backend systems. In 2026 it extends cleanly to LLM applications through two projects: OpenLLMetry (by Traceloop) and OpenInference (by Arize). Both ship instrumentors that emit OTel-compatible spans with LLM-specific semantic conventions. This article walks through why OTel for LLMs is the right choice for most production teams, how OpenLLMetry works end to end, and the specific routing patterns to send traces to Datadog, Grafana Tempo, Honeycomb, or any OTel backend.
Why OpenTelemetry for LLMs
The hidden cost of vendor-specific observability platforms is lock-in. Switching from LangSmith to Langfuse later means re-instrumenting every service and losing historical trace data. OpenTelemetry fixes this at the standard level: your instrumentation emits generic OTel spans that any OTel backend can consume.
Benefits:
- One instrumentation, many backends: send the same traces to Datadog, Jaeger, Grafana Tempo, Honeycomb, Phoenix, Langfuse, or any mix of these
- Unified traces across your stack: an LLM trace sits next to the HTTP request that triggered it and the database queries that followed, in one trace tree
- No vendor lock-in: switch backends by changing an environment variable, not rewriting code
- Mature ecosystem: OTel is a CNCF graduated project; the tooling around sampling, batching, and export is enterprise-grade
OpenLLMetry vs OpenInference
Two competing specifications exist for LLM semantic conventions in 2026:
OpenLLMetry (by Traceloop):
- Package:
traceloop-sdkor individual instrumentors likeopentelemetry-instrumentation-openai - Native OTel compliance; integrates cleanly with the full OTel collector pipeline
- Backend-neutral: send traces to Traceloop’s hosted platform OR any OTel backend
OpenInference (by Arize):
- Package:
openinference-instrumentation-openai(and 20+ others per library) - Co-developed with Arize Phoenix; works best when sending to Phoenix or Arize AX
- Also OTel-compliant: any OTel backend can consume OpenInference spans
Both emit valid OTel spans. The LLM semantic attributes differ slightly (OpenLLMetry uses llm.prompts, OpenInference uses llm.input_messages), which affects how your backend UI renders them. In 2026 the two specs are converging on an OTel-standardized GenAI semantic convention; expect them to merge within 12-18 months.
OpenLLMetry setup in 10 lines
from traceloop.sdk import Traceloop

Traceloop.init(
    app_name="my-ai-app",
    api_endpoint="https://api.traceloop.com",
    api_key=os.environ["TRACELOOP_API_KEY"],
)

# Now every OpenAI, Anthropic, LangChain, LlamaIndex, Haystack call auto-traces
from openai import OpenAI
client = OpenAI()
client.chat.completions.create(model="gpt-4o", messages=[...])
Behind the scenes, Traceloop.init() registers OTel instrumentors for 25+ supported libraries. Every subsequent LLM call emits a span with full prompt, response, tokens, cost, and latency.
Routing traces to any OTel backend
The real power of OTel is swapping backends freely. Set the standard OTel environment variables:
# Datadog
OTEL_EXPORTER_OTLP_ENDPOINT=https://trace.agent.datadoghq.com
OTEL_EXPORTER_OTLP_HEADERS=DD-API-KEY=your_key

# Grafana Tempo
OTEL_EXPORTER_OTLP_ENDPOINT=https://tempo-prod.grafana.net:443

# Honeycomb
OTEL_EXPORTER_OTLP_ENDPOINT=https://api.honeycomb.io:443
OTEL_EXPORTER_OTLP_HEADERS=x-honeycomb-team=your_key

# Local Phoenix
OTEL_EXPORTER_OTLP_ENDPOINT=http://localhost:4317
No code changes required. Traceloop SDK reads these env vars and routes traces accordingly. Multi-backend routing works via the OTel Collector sidecar; your app sends to the collector, which fans out to Datadog + Phoenix + S3 simultaneously.
The OTel Collector pattern for production
Running the OTel Collector between your app and backends gives you three big advantages:
- Buffering: if Datadog has a brief outage, the collector queues spans and retries. Your app does not block.
- Fan-out: send the same spans to multiple backends in one place. Many teams send to a cheap long-term store (S3) plus a hot analytics backend (Datadog) plus a dev-focused tool (Phoenix).
- PII redaction: strip sensitive fields from span attributes centrally. One place to maintain the redaction rules, not every service.
# otel-collector-config.yaml
receivers:
  otlp:
    protocols:
      grpc:
        endpoint: 0.0.0.0:4317

processors:
  attributes/pii:
    actions:
      - key: llm.prompts
        action: hash
      - key: user.email
        action: delete

exporters:
  datadog:
    api:
      key: ${DD_API_KEY}
  otlphttp/phoenix:
    endpoint: http://phoenix:6006/v1/traces

service:
  pipelines:
    traces:
      receivers: [otlp]
      processors: [attributes/pii]
      exporters: [datadog, otlphttp/phoenix]
Sampling strategies for high-volume apps
Full-fidelity tracing (every request) costs money at scale. Four common sampling strategies:
- Head-based ratio: sample X% of all requests. Simple, fast, misses rare but important traces. Example: 10% in production.
- Tail-based: capture every trace, then after the trace completes, decide whether to keep based on duration/error. Keeps all errors and slow requests, drops fast successful ones.
- Priority sampling: tag requests with priority upstream (high-value user: keep 100%, low-value: keep 1%). Preserves what matters.
- Error-biased: 100% of errors + 5% of successes. Error analysis is what you usually need in production.
Tail-based is the most useful for LLM observability since errors are rare but critical and most successful traces are redundant. Configure in the OTel Collector tail_sampling processor.
What OTel gets you that vendor platforms do not
- Unified traces: the HTTP request, the LLM call it triggered, and the Postgres query that fed context all live in ONE trace tree. Vendor-specific tools silo LLM spans away from the rest of your infrastructure.
- Standard sampling + batching: proven OTel infrastructure (collector, agents) rather than vendor-proprietary pipelines.
- Portability: changing observability vendors becomes a 1-day migration (point exporters at new backend) rather than a 1-quarter instrumentation rewrite.
- Multi-signal correlation: OTel captures logs, metrics, and traces in one spec. Future-proof as you add more signals.
When OTel LLM tracing is NOT the right fit
- You use LangChain exclusively: LangSmith’s native integration + playground is tighter and faster to iterate. OTel is overkill for an all-LangChain shop.
- You need prompt playground + versioning: LangSmith and Langfuse have the best playgrounds; OTel backends are not designed for prompt iteration.
- You are prototype-stage: setting up OTel Collector is heavyweight for a single-dev side project. Use LangSmith free tier or local Phoenix until you need the fan-out.
Standardization in 2026 and beyond
The OpenTelemetry community merged the GenAI semantic conventions into the official OTel specification in late 2025 and the first stable version shipped mid-2026. This means every OTel-compatible backend (not just LLM-specialized tools) now understands LLM span attributes natively. Datadog, Honeycomb, Grafana, and New Relic all added LLM-view dashboards powered by the standard conventions in Q2-Q3 2026.
The practical effect: instrumentation stability. The attribute names (gen_ai.request.model, gen_ai.response.model, gen_ai.usage.input_tokens) are now standardized across every OTel implementation. OpenLLMetry and OpenInference both target these conventions as of their 2026 releases, so switching between them produces compatible spans.
What this unlocks:
- Vendor-neutral LLM dashboards built on standard attributes
- Cross-tool queries (“find all GPT-4o spans with cost > $0.10”) work across any backend
- Open-source observability stacks (Grafana + Tempo + Loki) now compete with specialized LLM tools at zero license cost
- Instrumentation code written in 2026 stays valid as the ecosystem evolves
The lesson for new deployments: use OTel-native instrumentation (either OpenLLMetry or OpenInference) and the specific backend becomes a swappable detail. Lock-in moves from your instrumentation code to your backend choice, which is a far cheaper migration if you ever need to switch.
Frequently Asked Questions
Can I use OpenLLMetry and OpenInference together?
Yes, but it is noisy. Both will instrument the same OpenAI calls and emit duplicate spans. Pick one per codebase. If you need to migrate, instrument services one at a time; do not run both in the same service.
Does OTel work with Anthropic and Google Gemini?
Yes. Both OpenLLMetry and OpenInference ship Anthropic + Google instrumentors. Spans look identical in shape; the llm.vendor attribute distinguishes them.
How much does the OTel Collector cost to run?
Negligible. A single Collector pod handles 10K+ spans/second on 2 CPU + 2GB RAM. For high-volume apps run 3+ replicas behind a load balancer; infrastructure cost is dominated by your downstream backend (Datadog etc), not the Collector itself.
Can I use Datadog’s native LLM Observability feature instead?
Yes, Datadog shipped first-class LLM observability in 2024 and matured it through 2026. It uses OpenAI/Anthropic instrumentors under the hood (same libraries as OpenLLMetry). Pick Datadog LLM Obs if your org is already on Datadog; it keeps LLM traces in the same UI as the rest of your APM.
Does OTel for LLMs add measurable latency?
Under 5ms per request with batching enabled (the default). Spans export asynchronously; your request completes before the trace reaches the backend. Setting batch_size and schedule_delay in the exporter tunes this trade-off.
What about logging prompts for PII compliance?
By default, OpenLLMetry and OpenInference both capture full prompt and response text. For PII-sensitive applications, use the OTel Collector attributes processor to hash or redact fields before export (as shown in the Collector config above). Downstream backend never sees the raw sensitive data.
Official documentation

Joken E. Villanueva
Founder & Lead Developer at PIES IT Solution
Founder of PIES Information Technology Solutions, a software company building production-grade applications for institutions across the Philippines. Over 8 years of hands-on full-stack development experience, currently leading the development of ClinicAI, an AI-powered clinic management platform.
Expertise: PHP · MySQL · JavaScript · AI Integration · SaaS Architecture · VB.NET · Database Design · Capstone Documentation · Java · View all posts by Joken E. Villanueva →