
The short answer
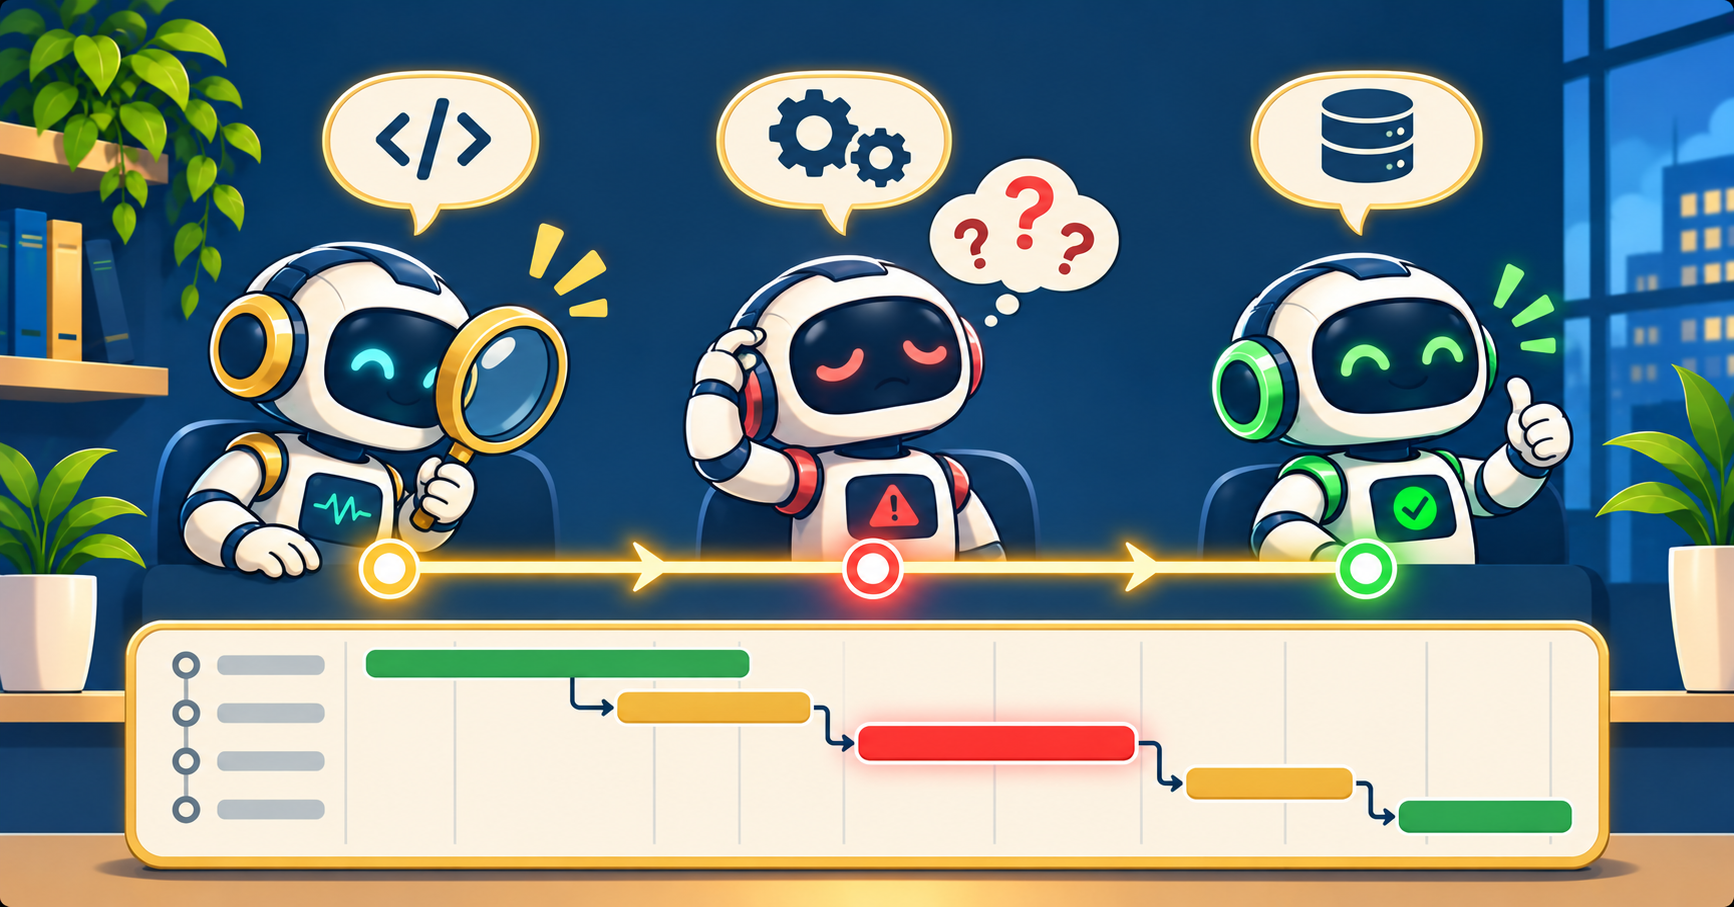
Multi-agent systems fail in ways single-model systems do not: one agent misroutes a task, a sub-agent returns garbage, a loop never terminates. LangSmith and Arize Phoenix are the two leading observability tools for tracing these failures. Instrument your agent with OpenTelemetry or the vendor SDK, record every LLM call and tool invocation, then filter traces by status and latency to find the broken span fast.
Quick step-by-step summary (click to expand)
- Pick a tracing backend. Choose LangSmith for a hosted service tied to LangChain, Phoenix for OSS self-hosted OpenTelemetry-native.
- Install the SDK. pip install langsmith or pip install arize-phoenix in your agent’s virtualenv.
- Set API key and project name. Export LANGCHAIN_API_KEY and LANGCHAIN_PROJECT for LangSmith, or run phoenix server for Phoenix.
- Instrument your agent. Wrap LLM calls and tool calls with the tracing decorator so every span is recorded.
- Run the failing scenario. Reproduce the failure once so the trace appears in the dashboard.
- Filter by status and latency. Sort traces by error status or long latency to find the broken span.
- Inspect the span inputs and outputs. Expand the span tree to see exactly what each agent received and returned.
A multi-agent system is any pipeline where more than one LLM call happens on a single user request. A supervisor agent routes to specialists. A planner writes a plan and an executor runs it. A tool-using agent calls 10 different APIs across 15 model turns. When these systems break, the question is never “what did Claude say” but “which of the 47 model calls returned the wrong answer and why.”
This tutorial walks through tracing agent failures with LangSmith (hosted, by LangChain) and Arize Phoenix (open source, OpenTelemetry-native). By the end you will have an instrumented agent and know how to find the broken span in under 30 seconds.
Why multi-agent debugging is different
A single model call is easy to debug. You see the prompt, you see the completion, you compare. A 20-step agent run has 20 prompts, 20 completions, dozens of tool calls, and a branching decision tree. Print statements and log files stop scaling at step 5.
Tracing tools solve this by recording every LLM call and tool invocation as a structured span, nested in a tree that matches the agent’s actual execution. You can click into any span, see the exact prompt sent, the exact response received, and the exact tool output that fed the next step.
LangSmith versus Phoenix: which to pick
LangSmith is a hosted SaaS from the LangChain team. You sign up at smith.langchain.com, get an API key, and your traces start showing up in a web dashboard. First 5,000 traces per month are free. Paid tier starts at $39 per user per month.
Phoenix is open source, built by Arize. You run it yourself with docker run arize-phoenix:latest, and it accepts any OpenTelemetry trace. Zero cost, but you host the server and the UI yourself.
For teams already using LangChain or LangGraph, LangSmith wins because the tracing is wired in automatically. For teams on raw OpenAI SDK, Anthropic SDK, or custom agent frameworks, Phoenix wins because OpenTelemetry works everywhere.
Step 1: Install the SDK
For LangSmith:
pip install langsmith
For Phoenix:
pip install arize-phoenix openinference-instrumentation-openai openinference-instrumentation-langchain
Step 2: Set keys and project
LangSmith:
export LANGCHAIN_TRACING_V2=true
export LANGCHAIN_API_KEY="lsv2_..."
export LANGCHAIN_PROJECT="my-agent-debug"
Phoenix:
python -m phoenix.server.main serve
# then in a second shell:
export PHOENIX_COLLECTOR_ENDPOINT="http://localhost:6006/v1/traces"
Step 3: Instrument your agent
With LangChain / LangGraph, instrumentation is automatic once the env vars are set. No code changes needed.
For a raw agent loop:
from langsmith import traceable
from anthropic import Anthropic

client = Anthropic()

@traceable(run_type="llm", name="planner_call")
def planner(user_request):
    return client.messages.create(
        model="claude-opus-5-5", max_tokens=1024,
        messages=[{"role": "user", "content": user_request}],
    )

@traceable(run_type="tool", name="database_query")
def query_db(sql):
    # your tool code
    return execute(sql)

@traceable(run_type="chain", name="agent_run")
def run_agent(request):
    plan = planner(request)
    for step in parse_plan(plan):
        result = query_db(step.sql)
    return result
For Phoenix with the OpenInference auto-instrumentation:
from openinference.instrumentation.openai import OpenAIInstrumentor
from openinference.instrumentation.langchain import LangChainInstrumentor
OpenAIInstrumentor().instrument()
LangChainInstrumentor().instrument()
# every OpenAI and LangChain call is now auto-traced
Step 4: Reproduce the failure
Run your agent once with the failing input. Both tools capture the trace immediately. In LangSmith, open the project page and refresh. In Phoenix, open http://localhost:6006 in a browser.
You will see a tree view of spans. Each node is one LLM call or tool call. Red nodes mean errors. Long bars mean slow spans. Click any node to see the inputs and outputs.
Step 5: Filter by status and latency
In the dashboard, filter traces by:
- Status equals error: finds the span that threw
- Latency greater than 10s: finds the slow outlier span
- Token count greater than 8000: finds the prompt that blew up context
- Child count greater than 20: finds loops that never terminated
In my experience, 80% of multi-agent failures fall into one of these four categories. The filter view narrows a thousand traces to the three that matter.
Step 6: Inspect span inputs and outputs
Click the broken span. You see three panels: the exact prompt sent, the exact response received, and the parent span that invoked it. Now you can answer:
- Did the supervisor route to the right specialist? Check the supervisor span’s output.
- Did the specialist get the context it needed? Check the specialist span’s input.
- Did the tool return what the agent expected? Check the tool span’s output and the next LLM span’s input.
Most multi-agent failures turn out to be either a routing mistake or a tool returning data in a format the next agent did not expect. Both are easy to fix once you can see them.
Step 7: Compare runs side by side
Both tools let you pin two traces next to each other. Compare a passing run against a failing one and the divergence point jumps out immediately. This is especially useful for flaky agents where the same input sometimes works and sometimes does not.
Common pitfalls
Four traps to avoid:
- Not instrumenting tool calls. LLM-only traces miss the biggest source of agent failure, which is tools returning unexpected shapes.
- Logging secrets into spans. Sanitize prompts and outputs before sending them to the tracing backend.
- Sampling too aggressively. Multi-agent runs are rare enough that you want 100% sampling in development.
- Not tagging runs. Add tags like “prod” or “user_id_123” so you can filter later.
Multi-agent systems reward investment in observability. The teams that ship reliable agents all have one thing in common: they can replay any failed run in under a minute and point to the exact span that misbehaved. Feel free to comment below if you want our LangSmith test project template or want help choosing between the two for your specific stack.
Official documentation
Frequently asked questions
Can I use both LangSmith and Phoenix at the same time?
Yes. Both accept OpenTelemetry traces. You can send the same span to both by configuring two OTEL exporters. Useful if you want LangSmith for production monitoring and Phoenix for local dev.
Does Phoenix work with Claude Code SDK?
Yes. Install openinference-instrumentation-anthropic alongside Phoenix, and every Claude API call is automatically traced.
How do I handle PII in traces?
Both tools support redaction. LangSmith has a redaction config in the SDK. Phoenix lets you filter spans server-side with custom processors. Sanitize at the SDK layer so secrets never leave your process.
Is self-hosted Phoenix production-ready?
Yes for teams up to about 100 developers. Beyond that, the Postgres-backed server needs tuning. Arize sells a managed version if you need enterprise-scale.
Can I trace streaming responses?
Yes. Both tools record streaming completions as a single span with the final concatenated text. You lose per-chunk timing but gain a readable span.
How long do traces stay in LangSmith?
30 days on the free tier, 90 days on Plus, custom retention on Enterprise. Phoenix retention depends on your Postgres disk.

Angel Jude Suarez
Full-Stack Developer at PIES IT Solution
Focuses on Python development, machine learning, and AI integration. Has built production AI systems including OpenAI Whisper integration for medical transcription and GPT-4o-powered diagnosis assistance. Strong background in pandas, scikit-learn, and TensorFlow.
Expertise: Python · PHP · Java · VB.NET · ASP.NET · Machine Learning · AI Integration · OpenCV · Django · CodeIgniter · View all posts by Angel Jude Suarez →