
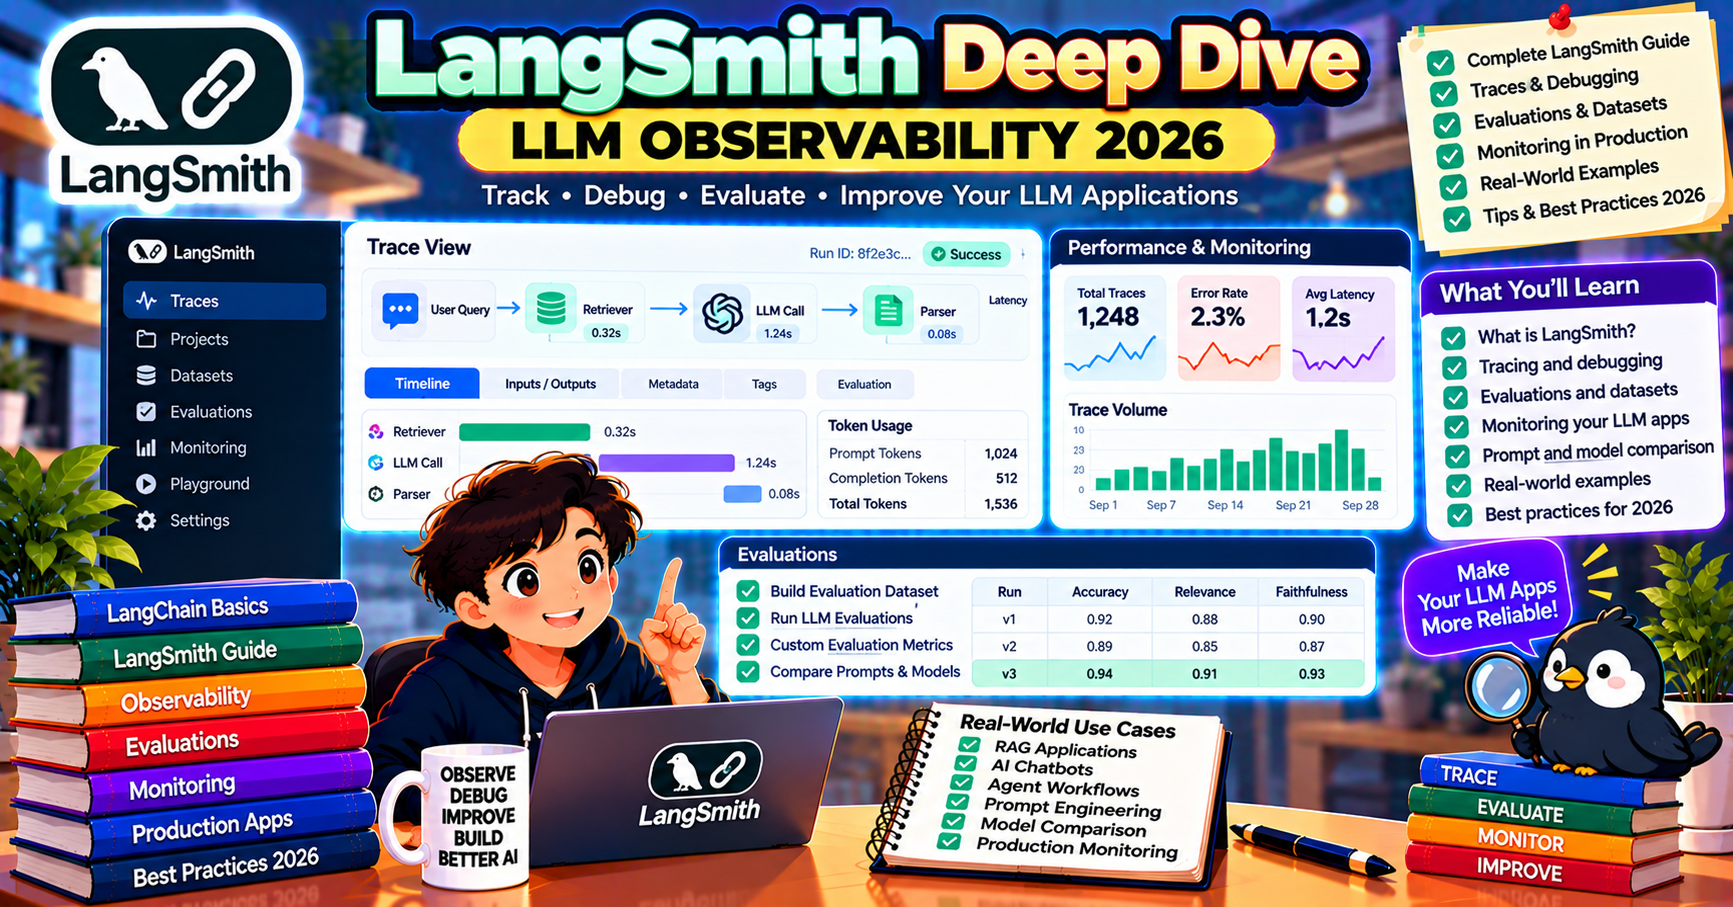
LangSmith is the observability platform most teams reach for when their LangChain or LangGraph application leaves prototype. It traces every LLM call, tool invocation, and chain step, lets you evaluate output against test datasets, and shows you where latency and cost pile up. This article is a hands-on deep dive into what LangSmith actually gives you, how to wire it in, and when it beats self-hosted observability.
What LangSmith is for
LLM applications are hard to debug because the model is a black box and the inputs are messy strings. A traditional APM tool (Datadog, New Relic) tells you an API call took 2.3 seconds but gives you nothing about why. LangSmith is purpose-built for LLM debugging: every call captures the full prompt, the model’s response, the token count, latency per step, and the cost. When something goes wrong, you can click into the trace and see exactly which step produced the bad output.
Three capabilities that drive adoption:
- Tracing: every LangChain, LangGraph, or raw LLM call is captured as a span tree. Debug multi-step agents by clicking through the graph.
- Datasets and evaluations: upload a test set, run your pipeline, score outputs with custom metrics or LLM-as-judge. Rerun on every change.
- Prompt playground: edit the system prompt and re-run against a dataset without touching code. Fast iteration cycle for prompt tuning.
Pricing in 2026
- Developer tier: free, up to 5000 traces per month
- Plus tier: $39 per user per month, 10K traces per user included, pay-as-you-go beyond
- Startup tier: $99 per month, 50K traces included, shared workspace
- Enterprise: custom pricing, SSO, SOC 2, self-hosted option
For most startups, the Plus tier is the right pick. A trace is one top-level LLM call or chain run (not one span). A moderately active development team easily uses 10K to 50K traces per month during active iteration.
Setup in under 5 minutes
pip install langsmith langchain-openai

# .env
LANGSMITH_API_KEY=lsv2_pt_...
LANGSMITH_TRACING=true
LANGSMITH_PROJECT=my-chatbot
That is it. Any LangChain, LangGraph, or OpenAI SDK call made from your code is now traced. Open smith.langchain.com and your traces show up in real-time.
Trace anatomy
Every trace captures:
- Full input (user message, system prompt, previous history)
- Full output (model response, tool calls, errors)
- Latency broken down by step
- Token count (prompt and completion)
- Cost estimate (per model’s known pricing)
- Metadata (user id, session id, environment tags you set)
For multi-step agents, the trace is a tree. Clicking the parent trace expands into child spans: the LLM call that decided which tool to use, the tool invocation itself, the tool result, the follow-up LLM call that synthesized the final answer. You see each one with its own input, output, latency, and cost.
Datasets and evaluation
The feature that separates serious shops from prototype shops. Build a test set once:
from langsmith import Client

client = Client()
dataset = client.create_dataset(
    dataset_name="support-tickets-v1",
    description="50 real support tickets with correct categories",
)
client.create_examples(
    dataset_id=dataset.id,
    examples=[
        {"inputs": {"text": "My card was charged twice"}, "outputs": {"category": "billing"}},
        {"inputs": {"text": "Export button is grayed out"}, "outputs": {"category": "bug"}},
        # ... 48 more
    ],
)
Then run your pipeline against the dataset and score it:
from langsmith.evaluation import evaluate

def classify(inputs):
    return my_pipeline(inputs["text"])

def accuracy(run, example):
    return {"score": run.outputs["category"] == example.outputs["category"]}

evaluate(classify, data="support-tickets-v1", evaluators=[accuracy])
The evaluation runs your pipeline on every example, scores each with your metric, and gives you a dashboard view of accuracy, latency, and cost over the full dataset. Rerun on every prompt or model change and compare runs side by side.
The prompt playground
Open any traced call in LangSmith and click “Open in Playground”. The playground lets you edit the system prompt, swap the model, change temperature, and re-run against the same inputs. Changes are not deployed to your code until you commit them; the playground is strictly for iteration.
The playground also supports running against a saved dataset, which means you can prompt-tune AND evaluate against your test set without writing any code. Non-engineers (PMs, writers) use this to tune prompts without a dev loop.
Alternatives and when to use them
- LangFuse: open-source alternative. Self-hostable, LangChain-friendly, cheaper for high-volume. Pick this if LangSmith’s pricing becomes an issue at scale or data residency matters.
- Arize Phoenix: open-source, OpenTelemetry-based, strong on evaluation metrics. Pick this if you want OTel-native tracing across your whole stack.
- Datadog LLM Observability: Datadog added LLM-specific tracing in 2024. Pick this if your org is already on Datadog and you want LLM traces in the same UI as the rest of your APM.
- Weights & Biases Weave: strong on experiment tracking across fine-tunes and model versions. Pick this if your team is already on W&B for ML experiments.
LangSmith’s advantage: first-class integration with LangChain and LangGraph (the two platforms it was built for), fastest setup, and the playground is unmatched by any alternative in 2026.
Common failure modes and how to catch them
LangSmith traces reveal recurring problems that are nearly invisible without observability. Four show up on almost every production pipeline:
- Silent prompt drift: an engineer tweaks a prompt file, forgets to update the eval dataset, and the production bot regresses on a case it used to handle. Trace diff between runs shows the exact output change.
- Tool-call thrashing: an agent calls the same tool 5 times with slightly different args, each failing. The trace tree shows the loop at a glance; without it, you only see “the agent took 40 seconds”.
- Token-count explosions: a RAG pipeline retrieves 20 chunks instead of 5 because a filter condition broke. Each call suddenly uses 15K tokens instead of 3K. LangSmith’s cost per trace chart flags the spike before the monthly bill arrives.
- Partial failures hidden by retries: your pipeline retries 3 times on failure. One out of three traces shows the raw error; the other two show the retry success. Only trace-level visibility catches the pattern.
Team workflows that work
Three patterns high-performing teams use in LangSmith:
- Shared workspace per product surface: one workspace for the chatbot, one for the internal agent, one for the batch classifier. Access control stays simple and traces stay findable.
- Project tag per environment: tag every trace with env=dev/staging/prod. Filter the UI to the environment you are debugging; dev noise does not drown out the production trace you came for.
- Trace link in every PR: when fixing an LLM bug, paste the LangSmith trace URL in the PR description. Reviewers see the broken behavior before and after without rerunning anything.
Frequently Asked Questions
Official documentation
Does LangSmith work with non-LangChain code?
Yes. The langsmith SDK has @traceable decorators you can apply to any Python function, which captures spans even without LangChain. For OpenAI SDK calls, LangSmith’s wrap_openai helper auto-traces every call. You do not have to be on LangChain to use LangSmith.
Can I self-host LangSmith?
Yes on the Enterprise tier. Self-hosted LangSmith runs in your own Kubernetes cluster. Pricing is custom. Most teams start on the cloud version and move to self-hosted only when compliance requires it.
How does LangSmith handle sensitive data in traces?
By default every trace captures the full prompt and response verbatim. For PHI, PII, or regulated data, you can mask fields with the @traceable decorator’s project_metadata parameter, or disable tracing for specific environments. For HIPAA workloads use the self-hosted tier.
What is a trace vs a span?
A trace is one end-to-end run (one user question through your pipeline). A span is one step inside that trace (one LLM call, one tool invocation). Pricing is counted in traces, not spans; a complex agent trace with 20 spans still counts as one trace.
Can I use LangSmith with LlamaIndex or Haystack?
Both have community integrations. LangSmith works best with LangChain and LangGraph; integration with other frameworks requires more manual wiring (either via OpenTelemetry or via explicit @traceable decorators around your framework calls).
How do I keep LangSmith costs predictable in production?
Sample. In production, trace 10% to 50% of requests rather than 100%. Set the LANGSMITH_SAMPLING_RATE environment variable to control this. Sampling preserves debuggability (you still catch most issues) while cutting trace volume proportionally.

Caren Bautista
Technical Writer at PIES IT Solution
Responsible for crafting clear, well-structured, and beginner-friendly content across the platform. Handles the writing, proofreading, and editorial review of tutorials, guides, and documentation to ensure every article is accurate, readable, and easy to follow.
Expertise: Technical Writing · Content Creation · Documentation · Editorial Writing · JavaScript · TypeScript · Python · Python Errors · HTTP Errors · MS Excel · View all posts by Caren Bautista →