Sentiment analysis is the most over-attempted NLP capstone in the country. Every batch has at least one group that says “we’re doing sentiment analysis” and every panel mentally rolls their eyes before the title defense even begins.
That’s not because sentiment analysis is bad. It’s because most students bring the wrong version of it.
The wrong version: “we used TextBlob to classify reviews as positive or negative.” That’s a Python library call. That’s not a capstone.
The right version: you trained your own classifier on your own data, ideally Tagalog or mixed-language reviews from a domain your school cares about, with three classes including neutral, a confidence threshold for uncertain inputs, and a dashboard that shows real aggregate insights. That’s a capstone.
This guide builds you the right version. Working app in 45 minutes. Customizable to whatever data you have or can collect.
What you’ll build
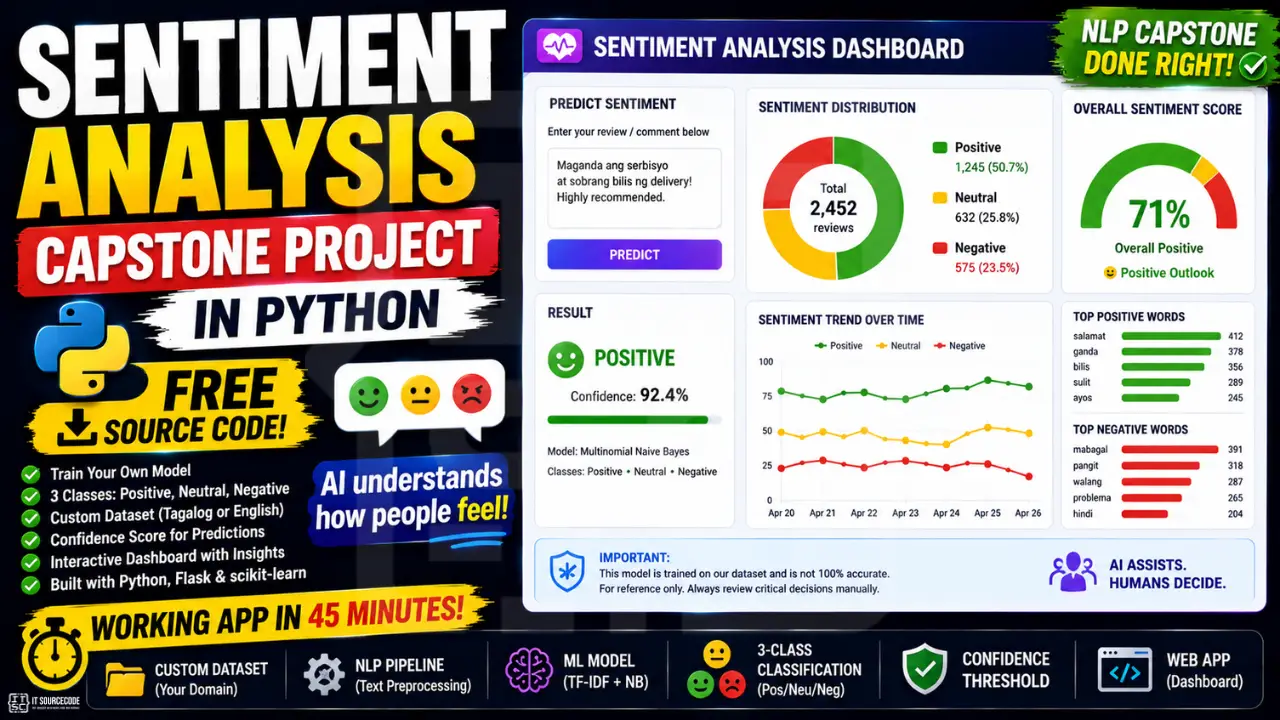
A small Flask web app with two views. The first view takes a single piece of text and returns its sentiment along with confidence and probability bars. The second view lets you upload a CSV of reviews and shows the sentiment distribution as a chart, so your panel sees aggregate insights, not just single predictions.
Features
- 3-class sentiment classifier (positive, neutral, negative)
- Trained on your own CSV of reviews, tweets, or feedback
- Flask web app with single-message and bulk-CSV modes
- Confidence score and class probability breakdown per prediction
- Fallback message when confidence is too low
- Distribution chart for bulk analysis (Chart.js)
Tech stack
- Python 3.10 or higher
- scikit-learn (TF-IDF + Logistic Regression)
- pandas (CSV handling)
- Flask (web server)
- Chart.js (frontend chart, loaded via CDN)
- Around 150 lines of code total
No external API. No paid service. Runs on any laptop.
Why 3-class beats binary
Most sentiment tutorials online split text into two buckets: positive or negative. That’s fine for textbook learning. It falls apart for real-world reviews.
Most product reviews are not strongly positive or strongly negative. They’re somewhere in the middle. “It’s okay.” “Not bad for the price.” “Mukhang ok naman pero medyo mahal.” These are neutral or mixed. If your classifier only knows positive and negative, it has to wrongly assign every neutral review to one side or the other.
Three classes fixes this. The panel will respect it. The data will reflect reality.
This matters even more in Filipino product reviews, which are heavily code-switched and rarely commit to strong positive or negative language. A 2-class model on Tagalog data will look about 60% accurate, which is barely better than guessing. A 3-class model with neutral handles it correctly.
Why classical ML, not BERT (for now)
You’ll see tutorials online using BERT or DistilBERT for sentiment analysis. They get higher accuracy. They also need a GPU, take 30 minutes to fine-tune, and are harder to explain to a panel who’s never heard of transformers.
For your first defense-ready version: TF-IDF and Logistic Regression. It trains in 5 seconds on any laptop. The math is teachable. The features are inspectable. The panel can ask “why did the model predict this” and you can actually answer.
If you have time after the working version is done, the Chapter 5 (Recommendations) section is the right place to add “we plan to compare with BERT fine-tuning in a future iteration.” That’s a strong move. Don’t lead with BERT.
Before you start
You need:
- Python 3.10 or newer
- A code editor. VS Code is fine
- At least 200 labeled examples in a CSV (we’ll discuss how to get them)
- About 45 minutes for the first run
If you don’t have labeled data yet, that’s not a blocker. Start with the example data in this guide to get the code running, then swap in your real data once you’ve collected it.
The dataset: what makes sentiment capstones defensible or not
This is the section students skip. Don’t.
Three rules for sentiment dataset:
Minimum 200 labeled examples, ideally 500+. Below 200 the model can’t learn well. Above 500 you start getting real defense-grade accuracy.
Balanced classes. If you have 600 positive reviews and 50 negative, your model will just predict positive 95% of the time and look 90% accurate while being useless. Aim for roughly equal counts in each class.
Labeling has to be defensible. If your panel asks “who labeled this data?” the answer should be a specific person or process. “I labeled them myself based on the star rating” is fine. “We labeled them as a team using a coding sheet with 5 example reviews per label” is even better.
Where to get labeled data:
- Shopee or Lazada product reviews: scrape with care, respect robots.txt and rate limits. The star rating becomes the label (1-2 stars = negative, 3 = neutral, 4-5 = positive).
- NLTK’s built-in
movie_reviewsdataset: fine for getting the code running, but don’t ship this as your final dataset. It’s English movie reviews from 2004 and panels will smell it from across the room. - Twitter/X dumps from Kaggle: search for “tagalog sentiment” or “filipino tweets.”
- Survey your school. Course evals. Faculty feedback. Suggestion box notes. Labeled by you and your team.
- Pay 3 friends to label 50 reviews each. 150 reviews in an afternoon. Coffee budget: 300 pesos.
The CSV format the code expects is dead simple:
text,label
"Maganda yung product, fast shipping",positive
"Ok lang naman",neutral
"Hindi gumagana, sayang ang pera",negative
Header row, then one row per labeled example. UTF-8 encoded.
“We labeled 600 reviews ourselves from real Shopee data”. That is the sentence that wins the defense. Build the dataset that lets you say it honestly.
Project file structure
sentiment-capstone/
├── train.py
├── analyzer.py
├── app.py
├── reviews.csv
├── model/
│   └── model.pkl
├── templates/
│   ├── index.html
│   └── dashboard.html
├── static/
│   └── style.css
└── requirements.txt
Create the folder. We’ll fill in the files below.
Step 1: Install the dependencies
pip install flask scikit-learn pandas numpyCreate requirements.txt:
flask==3.0.0
scikit-learn==1.4.0
pandas==2.2.0
numpy==1.26.0
Step 2: Prepare your dataset (reviews.csv)
To get the code running, start with this example data. Replace it with your real data later.
text,label
"Maganda yung product, fast shipping, super sulit!",positive
"I love it, exactly as described, would buy again",positive
"Sobrang ganda ng quality, lalo na sa price",positive
"Highly recommend, fast delivery and great packaging",positive
"Solid build quality, masaya ako sa purchase ko",positive
"Excellent service from the seller, very responsive",positive
"Ok lang naman, walang masyadong pagkakaiba sa iba",neutral
"It's fine, nothing special, gets the job done",neutral
"Average product, hindi naman nakakadismaya",neutral
"Pwede na, hindi naman ako masyadong impressed",neutral
"Mukhang ok pero medyo mahal para sa quality",neutral
"It works as expected, walang sorpresa",neutral
"Hindi gumagana, sayang ang pera ko",negative
"Terrible quality, broke after one week",negative
"Sira na nung dumating, ang sama ng packaging",negative
"Worst purchase, hindi worth it kahit konti",negative
"Defective unit, walang reply ang seller",negative
"Late delivery, wrong item, very disappointing",negative
Save as reviews.csv in the project root. Notice the mix of English, Tagalog, and code-switched lines. That is deliberate, and your real dataset should look similar if your audience is Filipino.
A real capstone should have at least 200 to 600 rows total, roughly balanced across the 3 labels. The 18 rows above are just to get the code running.
Step 3: Train the model (train.py)
Create train.py:
import os
import pickle
import pandas as pd
from sklearn.feature_extraction.text import TfidfVectorizer
from sklearn.linear_model import LogisticRegression
from sklearn.model_selection import train_test_split
from sklearn.metrics import classification_report, confusion_matrix

os.makedirs('model', exist_ok=True)

df = pd.read_csv('reviews.csv', encoding='utf-8')
df['text'] = df['text'].astype(str).str.lower().str.strip()
df = df.dropna(subset=['text', 'label'])

print(f"Total examples: {len(df)}")
print(df['label'].value_counts())

X_train, X_test, y_train, y_test = train_test_split(
    df['text'], df['label'], test_size=0.2, random_state=42, stratify=df['label']
)

vectorizer = TfidfVectorizer(ngram_range=(1, 2), min_df=1, max_df=0.95)
X_train_vec = vectorizer.fit_transform(X_train)
X_test_vec = vectorizer.transform(X_test)

model = LogisticRegression(max_iter=1000, class_weight='balanced')
model.fit(X_train_vec, y_train)

y_pred = model.predict(X_test_vec)
print("\nClassification Report:")
print(classification_report(y_test, y_pred))
print("\nConfusion Matrix:")
print(confusion_matrix(y_test, y_pred, labels=['negative', 'neutral', 'positive']))

with open('model/model.pkl', 'wb') as f:
    pickle.dump({'model': model, 'vectorizer': vectorizer}, f)

print("\nModel saved to model/model.pkl")
Run it:
python train.pyYou’ll see the class distribution, then the classification report (precision, recall, F1 per class), then the confusion matrix. Screenshot all three. They go straight into Chapter 4 of your documentation.
The class_weight='balanced' parameter is important. It tells the model to give more weight to underrepresented classes so it doesn’t lazy out and predict the majority class for everything.
Step 4: Build the analyzer (analyzer.py)
Create analyzer.py:
import pickle

class SentimentAnalyzer:
    def __init__(self, model_path='model/model.pkl', threshold=0.4):
        with open(model_path, 'rb') as f:
            data = pickle.load(f)
        self.model = data['model']
        self.vectorizer = data['vectorizer']
        self.threshold = threshold

    def predict(self, text):
        text = (text or '').lower().strip()
        if not text:
            return {'label': 'unknown', 'confidence': 0.0, 'probabilities': {}}

        X = self.vectorizer.transform([text])
        probs = self.model.predict_proba(X)[0]
        labels = self.model.classes_
        prob_dict = {label: round(float(p), 3) for label, p in zip(labels, probs)}

        max_idx = probs.argmax()
        confidence = float(probs[max_idx])
        label = labels[max_idx] if confidence >= self.threshold else 'uncertain'

        return {
            'label': label,
            'confidence': round(confidence, 3),
            'probabilities': prob_dict
        }
The threshold is set to 0.4. If no class has at least 40% confidence, we return “uncertain” instead of guessing. This is the kind of detail panels notice.
Step 5: Build the Flask app (app.py)
Create app.py:
import io
import pandas as pd
from flask import Flask, render_template, request, jsonify
from analyzer import SentimentAnalyzer

app = Flask(__name__)
analyzer = SentimentAnalyzer()

@app.route('/')
def index():
    return render_template('index.html')

@app.route('/predict', methods=['POST'])
def predict():
    text = request.json.get('text', '')
    return jsonify(analyzer.predict(text))

@app.route('/dashboard', methods=['GET', 'POST'])
def dashboard():
    if request.method == 'GET':
        return render_template('dashboard.html', summary=None)

    file = request.files.get('csv')
    if not file:
        return render_template('dashboard.html', summary=None, error="Upload a CSV file with a 'text' column.")

    df = pd.read_csv(io.StringIO(file.stream.read().decode('utf-8')))
    if 'text' not in df.columns:
        return render_template('dashboard.html', summary=None, error="CSV must have a 'text' column.")

    results = [analyzer.predict(t) for t in df['text'].astype(str).tolist()]
    counts = {'positive': 0, 'neutral': 0, 'negative': 0, 'uncertain': 0}
    for r in results:
        counts[r['label']] = counts.get(r['label'], 0) + 1

    return render_template('dashboard.html', summary=counts, total=len(results))

if __name__ == '__main__':
    app.run(debug=True, port=5000)
Two routes that matter: /predict for single-text inference, /dashboard for bulk CSV upload with aggregate counts.
Step 6: Build the UI
Create templates/index.html:
<!DOCTYPE html>
<html lang="en">
<head>
  <meta charset="UTF-8" />
  <title>Sentiment Analyzer</title>
  <link rel="stylesheet" href="/static/style.css" />
</head>
<body>
  <div class="container">
    <header>
      <h1>Sentiment Analyzer</h1>
      <p>Paste a review or tweet and see how the model classifies it.</p>
      <a href="/dashboard" class="link">Bulk CSV analysis →</a>
    </header>

    <form id="form">
      <textarea id="text" rows="4" placeholder="Type a review..."></textarea>
      <button type="submit">Analyze</button>
    </form>

    <div id="result" class="result hidden">
      <h2 id="label"></h2>
      <div id="bars"></div>
    </div>
  </div>

  <script>
    const form = document.getElementById('form');
    const result = document.getElementById('result');
    const labelEl = document.getElementById('label');
    const bars = document.getElementById('bars');

    form.addEventListener('submit', async (e) => {
      e.preventDefault();
      const text = document.getElementById('text').value.trim();
      if (!text) return;

      const res = await fetch('/predict', {
        method: 'POST',
        headers: { 'Content-Type': 'application/json' },
        body: JSON.stringify({ text })
      });
      const data = await res.json();

      labelEl.textContent = data.label.toUpperCase() + ' (' + (data.confidence * 100).toFixed(0) + '%)';
      bars.innerHTML = '';
      for (const [k, v] of Object.entries(data.probabilities)) {
        const row = document.createElement('div');
        row.className = 'bar-row';
        row.innerHTML = '<span>' + k + '</span><div class="bar"><div class="fill" style="width:' + (v * 100) + '%"></div></div><span>' + (v * 100).toFixed(0) + '%</span>';
        bars.appendChild(row);
      }
      result.classList.remove('hidden');
    });
  </script>
</body>
</html>
Next, add templates/dashboard.html:
<!DOCTYPE html>
<html lang="en">
<head>
  <meta charset="UTF-8" />
  <title>Sentiment Dashboard</title>
  <link rel="stylesheet" href="/static/style.css" />
  <script src="https://cdn.jsdelivr.net/npm/chart.js"></script>
</head>
<body>
  <div class="container">
    <header>
      <h1>Bulk Sentiment Analysis</h1>
      <p>Upload a CSV file with a "text" column.</p>
      <a href="/" class="link">← Single message</a>
    </header>

    <form method="POST" enctype="multipart/form-data">
      <input type="file" name="csv" accept=".csv" required />
      <button type="submit">Analyze</button>
    </form>

    {% if error %}<p class="error">{{ error }}</p>{% endif %}

    {% if summary %}
      <h2>Results: {{ total }} rows</h2>
      <canvas id="chart"></canvas>
      <script>
        new Chart(document.getElementById('chart'), {
          type: 'bar',
          data: {
            labels: {{ summary.keys()|list|tojson }},
            datasets: [{
              label: 'Count',
              data: {{ summary.values()|list|tojson }},
              backgroundColor: ['#2D6A4F', '#C9A961', '#b94a48', '#888']
            }]
          },
          options: { plugins: { legend: { display: false } } }
        });
      </script>
    {% endif %}
  </div>
</body>
</html>
Create static/style.css:
* { box-sizing: border-box; }
body {
  font-family: system-ui, -apple-system, sans-serif;
  margin: 0;
  background: #fafafa;
  color: #2c3e50;
}
.container {
  max-width: 640px;
  margin: 40px auto;
  background: white;
  border-radius: 12px;
  box-shadow: 0 4px 20px rgba(0,0,0,0.06);
  padding: 28px;
}
header h1 {
  margin: 0 0 4px;
  color: #1F3A5F;
}
header p { margin: 0 0 12px; color: #5a6a7a; }
.link {
  color: #C9A961;
  text-decoration: none;
  font-weight: 600;
}
textarea, input[type="file"] {
  width: 100%;
  padding: 10px;
  border: 1px solid #ddd;
  border-radius: 8px;
  font-size: 14px;
}
button {
  background: #1F3A5F;
  color: white;
  border: none;
  padding: 12px 20px;
  border-radius: 8px;
  cursor: pointer;
  margin-top: 8px;
}
.result { margin-top: 24px; padding-top: 24px; border-top: 1px solid #eee; }
.result.hidden { display: none; }
.result h2 { color: #1F3A5F; margin: 0 0 12px; }
.bar-row {
  display: grid;
  grid-template-columns: 80px 1fr 50px;
  gap: 10px;
  align-items: center;
  margin-bottom: 6px;
  font-size: 14px;
}
.bar {
  background: #f0f3f7;
  height: 12px;
  border-radius: 6px;
  overflow: hidden;
}
.fill {
  background: #C9A961;
  height: 100%;
  transition: width 0.3s;
}
.error {
  background: #fde8e8;
  color: #b94a48;
  padding: 10px 14px;
  border-radius: 8px;
}
Step 7: Run the analyzer
Train (run this once, or whenever reviews.csv changes):
python train.pyRun the server:
python app.pyOpen http://localhost:5000. Paste a review like “ang ganda naman nito” and watch the model predict positive with probability bars below. Try a neutral one like “ok lang naman” and see if it lands neutral.
Then visit http://localhost:5000/dashboard, upload a CSV of 50+ reviews with a text column, and watch the bar chart show the sentiment distribution.
If you got both views working, you’re already past the point where most sentiment groups stall.
How to defend this in your panel
Four questions every sentiment capstone hears.
“Is this just TextBlob or VADER?” No. The model is a Logistic Regression classifier trained on our own labeled dataset using TF-IDF features. You can inspect model.pkl. No third-party sentiment library was used. (Have the model file open if needed.)
“What model and why?” TF-IDF for feature extraction, Logistic Regression for classification. We compared with Naive Bayes and Linear SVM on our validation set. Logistic Regression had the best macro F1 score, especially on the neutral class. (Comparison table in appendix.)
“Where did your data come from?” Be specific. “We collected 600 product reviews from Shopee category X over Y days, labeled them ourselves using a 3-class coding sheet, and split them 80/20 for train/validation. The class distribution was Z positive, W neutral, V negative.”
“What happens with mixed or sarcastic reviews?” Our 3-class design includes a neutral category for mixed reviews. For sarcasm we acknowledge the limitation. Classical ML models without context don’t handle it well, which is why we have a confidence threshold of 0.4 that flags uncertain predictions for human review. (Show the “uncertain” fallback in action by inputting a sarcastic line.)
Answer all four cleanly and you’ll pass.
How to customize this for your domain
Same code, different CSV. Pick from:
- Shopee or Lazada reviews for a specific category (electronics, beauty, fashion).
- School feedback: course evaluations, faculty surveys, suggestion box notes.
- Restaurant or business reviews scraped from Google Maps or Facebook with permission.
- Politician or public figure tweets during election season (be careful with the framing: academic only, not advocacy).
- Customer support tickets from a small local business you can partner with.
- Hospital or clinic patient feedback with strong anonymization.
- Movie or game reviews in Tagalog from local Steam/Facebook groups.
- Suggestion box at your barangay hall: local government will give you data if you ask nicely.
The model doesn’t care about the domain. It cares about the labels being consistent.
Common errors and how to fix them
FileNotFoundError: reviews.csv: make sure the file is in the same folder as train.py. Check spelling exactly.
KeyError: 'label': your CSV header doesn’t match. Make sure column names are exactly text and label (lowercase).
All predictions are one class: class imbalance. Count rows per class, add more examples of the underrepresented ones.
Confidence always near 0.33: you probably have fewer than 30 training examples total. Add more.
UnicodeDecodeError: your CSV isn’t UTF-8 encoded. Re-save from Excel/Google Sheets as “CSV UTF-8”.
ValueError during train_test_split: you have a class with fewer than 2 examples. Each class needs at least a few examples for stratified split.
Dashboard chart doesn’t render: check that Chart.js loaded (look at browser console). The CDN line in dashboard.html must be intact.
How to extend this project
After the basic version works, these are Chapter 5 (Recommendations) extensions panels love:
- BERT or DistilBERT fine-tuning. Use Hugging Face to fine-tune a small transformer on your CSV. Compare accuracy with the classical version in your defense. “We compared classical ML with transformer-based fine-tuning” is a strong sentence.
- Multilingual sentiment. Train separate models for English, Tagalog, and Bisaya, or one combined model with language-tagged data.
- Aspect-based sentiment. Don’t just classify the whole review. Extract aspects (battery, screen, shipping, price) and rate each separately.
- Real-time tweet stream. Use the Twitter/X API (free tier) and classify tweets live in a dashboard.
- Topic modeling alongside sentiment. Use LDA or BERTopic to extract themes from negative reviews so businesses know what to fix.
- Mobile app deployment. Convert the model with
jobliband bundle inside a Flutter or Kivy app.
Free download: source code
UML diagrams you’ll need for documentation
Most schools require these for an NLP capstone:
- Use Case Diagram. actors: user, admin; actions: analyze text, upload CSV, view dashboard
- Activity Diagram. input → preprocess → vectorize → classify → display
- Sequence Diagram. request flow from browser to Flask to analyzer to response
- Class Diagram. SentimentAnalyzer class, Flask routes
- DFD Level 0 and Level 1. Text data flow from input through model to output
We have detailed guides on each diagram type. Use them as templates and adapt to this project.
Official documentation
Frequently Asked Questions
Is sentiment analysis a good capstone project for IT students in 2026?
Do I need to use BERT for a sentiment analysis capstone?
Where can I get a labeled dataset for sentiment analysis?
Can sentiment analysis work on Tagalog or Filipino text?
How many labeled reviews do I need for a sentiment capstone?
We are hoping this guide helps you build a defensible Tagalog or mixed-language sentiment classifier you can present in panel defense. If a CSV import, training, or accuracy bug blocks you while building yours, drop the error in the comments below and we will help you debug it. Thank you for reading itsourcecoders.
Ship it. Defend it. Beat the curve.
Sentiment analysis is the most common NLP capstone, which means it’s also the easiest one to make boring. Three things separate the groups that breeze through defense from the groups that don’t:
A real dataset they collected and labeled themselves. A 3-class design with confidence thresholds, not naive binary. A dashboard that shows aggregate insights, not just single predictions.
This code gives you all three. Your job is to find the data.
For more NLP and AI capstone source code, browse our Python projects library. If you haven’t picked your capstone topic yet, see 150 Best Capstone Project Ideas for IT Students 2026. And for the UML diagrams your documentation will need, our UML guides cover every diagram type panels ask about.
Now go scrape some reviews. Your capstone starts with the CSV.
More capstone project ideas to browse
Looking for more ideas to pitch your panel? Browse our capstone idea collections:

Adrian Mercurio
Full-Stack Developer at PIES IT Solution
Specializes in building complete capstone projects with full documentation. Strong background in PHP/MySQL development and database design. Has personally built and tested over 30 capstone-ready projects with ER diagrams, DFDs, and chapter-by-chapter thesis documentation.
Expertise: PHP · Laravel · Database Design · Capstone Projects · C# · C · C++ · Python · AI Projects · View all posts by Adrian Mercurio →