
Point of Sales and Inventory System Database Design
Point of Sales and Inventory System Database Design is a simple Database Design that will be used for creating a Java Application project. The system is built using the NetBeans IDE.
A Sales and Inventory System is all about buying and selling of good computer stuff and products. This Sales and Inventory System database design consists of requirements which are needed for the system.
It is easy to use program, user-friendly kind of system. This system is similar to the inventory or should I say that I put the inventory system on it.
The sales and inventory system will provide you the efficiency to look over your order and check them, and also you can use it to monitor them.
Continuation…
My Sales and Inventory System gives you the ability to check on your products, add customers, manage suppliers, and you can also modify them and more.
The system does perform all the functions like ADD, DELETE, UPDATE, REGISTER ACCOUNTS, and many more.
The system also has a dark and straightforward box line design for the “comfortability” of your eyes, and it is also well organized for a user to use the program at ease.
You will see that there is a graph which allows you to know the exact details of which of your product is getting more demands or details.
You can check them accordingly to your own will, and you can either check them daily, weekly, or even monthly.
And like I mentioned earlier that this sales and inventory system looks like an inventory system because you can look after your product and their details. And you can manage them.
Entity Relationship Diagram of Sales and Inventory System
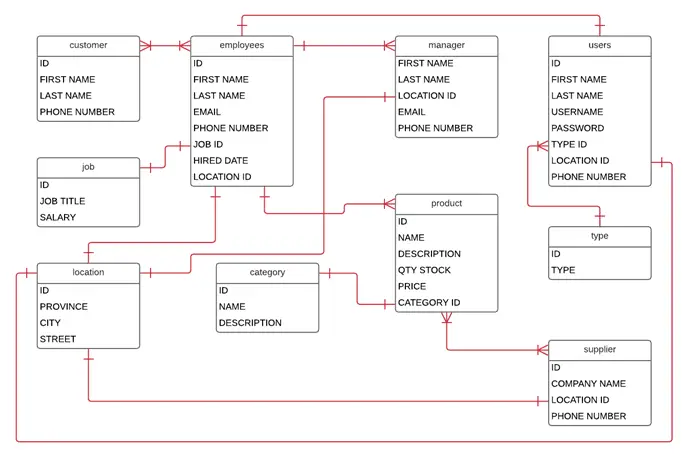
Data Dictionaries of Sales and Inventory System Database Design
Table 1: category
| Fieldname | Description | Type | Length |
| CATEGORY_ID | category id number | int | 2 |
| NAME | category name | varchar | 50 |
| DESCRIPTION | description of the group | varchar | 100 |
Table 2: customer
| Fieldname | Description | Type | Length |
| CUST_ID | customer ID number | int | 11 |
| FIRST_NAME | customer first name | varchar | 50 |
| LAST_NAME | customer last name | varchar | 50 |
| PHONE_NUMBER | the contact number of customer | int | 11 |
Table 3: employees
| Fieldname | Description | Type | Length |
| EMPLOYEE_ID | employee id number | int | 11 |
| FIRST_NAME | employee first name | varchar | 50 |
| LAST_NAME | employee last name | varchar | 50 |
| the email address of the employee | varchar | 100 | |
| PHONE_NUMBER | the contact number of the employee | int | 11 |
| JOB_ID | job id number | int | 11 |
| HIRED_DATE | The date that the employee hired. | date | |
| LOCATION_ID | location id number | int | 11 |
Table 4: job
| Fieldname | Description | Type | Length |
| JOB_ID | position in number | int | 11 |
| JOB_TITLE | title of position | varchar | 50 |
| SALARY | monthly salary | int | 50 |
Table 5: location
| Fieldname | Description | Type | Length |
| LOCATION_ID | location id number | int | 11 |
| PROVINCE | location within a country | varchar | 50 |
| CITY | city or province | varchar | 50 |
| STREET | street of the town | varchar | 50 |
Table 6: manager
| Fieldname | Description | Type | Length |
| FIRST_NAME | first name of the manager | varchar | 50 |
| LAST_NAME | last name of the manager | varchar | 50 |
| LOCATION_ID | location id number | int | 11 |
| the email address of the manager | varchar | 50 | |
| PHONE_NUMBER | the contact number of the manager | int | 11 |
Table 7: product
| Fieldname | Description | Type | Length |
| PRODUCT_ID | product id number | int | 11 |
| NAME | product name | varchar | 50 |
| DESCRIPTION | product’s description | varchar | 100 |
| QTY_STOCK | stock quantity of product | int | 50 |
| PRICE | price of the product | int | 50 |
| CATEGORY_ID | category id number | int | 11 |
Table 8: supplier
| Fieldname | Description | Type | Length |
| SUPPLIER_ID | supplier id number | int | 11 |
| COMPANY_NAME | supplier’s the company name | varchar | 50 |
| LOCATION_ID | location id number | int | 11 |
| PHONE_NUMBER | the contact number of the supplier | int | 11 |
Table 9: type
| Fieldname | Description | Type | Length |
| TYPE_ID | type id number | int | 11 |
| TYPE | type of user account registered | varchar | 50 |
Table 10: users
| Fieldname | Description | Type | Length |
| ID | account id number | int | 11 |
| FIRST_NAME | first name of the user | varchar | 50 |
| LAST_NAME | last name of the user | varchar | 50 |
| USERNAME | username of the user | varchar | 50 |
| PASSWORD | the password of the user | varchar | 50 |
| TYPE_ID | type id number | int | 11 |
| LOCATION_ID | location id number | int | 11 |
| PHONE_NUMBER | the contact number of the user | int | 11 |
Table Keys
| Table Name | Fieldname | Key Type |
| category | CATEGORY_ID | PK |
| customer | CUST_ID | PK |
| employee | EMPLOYEE_ID | PK |
| job | JOB_ID | PK |
| location | LOCATION_ID | PK |
| product | PRODUCT_ID | PK |
| supplier | SUPPLIER_ID | PK |
| type | TYPE_ID | PK |
| users | ID | PK |
| employee | LOCATION_ID | FK |
| employee | JOB_ID | FK |
| manager | LOCATION_ID | FK |
| product | CATEGORY_ID | FK |
| supplier | LOCATION_ID | FK |
| users | TYPE_ID | FK |
| users | LOCATION_ID | FK |
Features of the Sales and Inventory System Database Design:
- INVENTORY CONTROL
- The stocks level will be automatically updated when the sales and purchases are made.ove stock and inventory tracking through automatically updated stock levels whenever sales and purchases are made. You can manage your inventory across multiple suppliers.
- INVENTORY OPTIMIZATION
Allows you to have the right amount of stock at the right time. Streamline your internal operations through automated demand forecasting, inventory optimization, and reorder points.
- SALES REPORT
Access and generate accurate sales reports that offer insights for better business decisions, all in real-time. My software allows you to create a sales history.
- ORDER MANAGEMENT
Synchronize your orders with your inventory and increase your business efficiency from order creation to fulfillment.
- CUSTOMER RELATIONSHIP
Keep all your customer and supplier data in one place.
- PRICE LIST
Managing product prices is the key to running a business.
- POINT OF SALE
Sell your product at Ease.
This Database design created by Prince. Cesar
For Complete Documentation of Sales and Inventory System Thesis Document, use the following links below:
- Sales and Inventory System Documentation Chapter 1
- Sales and Inventory System Documentation Chapter 2
- Sales and Inventory System Documentation Chapter 3
- Sales and Inventory System Documentation Chapter 4
- Sales and Inventory System Documentation Chapter 5
Official documentation
Quick step-by-step summary (click to expand)
- Review the ER diagram in this article. Study the entity-relationship diagram on this page. Note the primary keys, foreign keys, and cardinality between the products, customers, and sales tables.
- Install MySQL or use XAMPP. Install MySQL Server 8 or use XAMPP if you already have PHP set up. Both let you run the schema locally.
- Create the database. Open MySQL Workbench or phpMyAdmin. Run CREATE DATABASE sales_inventory then USE sales_inventory to select it.
- Run the CREATE TABLE statements. Copy the CREATE TABLE code from this article into the SQL editor and run it in order (start with tables that have no foreign keys).
- Insert sample data and test relationships. Insert 3-5 rows into each table with realistic values. Run a JOIN query to confirm the foreign keys resolve correctly before you build any UI on top.

Joken E. Villanueva
Founder & Lead Developer at PIES IT Solution
Founder of PIES Information Technology Solutions, a software company building production-grade applications for institutions across the Philippines. Over 8 years of hands-on full-stack development experience, currently leading the development of ClinicAI, an AI-powered clinic management platform.
Expertise: PHP · MySQL · JavaScript · AI Integration · SaaS Architecture · VB.NET · Database Design · Capstone Documentation · Java · View all posts by Joken E. Villanueva →
Working source code for this system
Download the actual implementation of this system in your preferred language. Each project includes source code, database, and setup instructions for BSIT capstone use.
Frequently asked questions
What is a ER diagram used for in BSIT capstone?
An ER diagram shows the database schema: entities (tables), attributes (columns), and relationships (foreign keys, cardinality). It goes in Chapter 3 alongside the class diagram to communicate the data storage design.
What tool should I use to draw the ER diagram?
Free options: draw.io (browser-based, saves to Google Drive), Lucidchart free tier, PlantUML (text-based, version-controllable), StarUML (30-day trial then reduced feature set), Visual Paradigm Community Edition. Paid options: Microsoft Visio, Lucidchart pro, Enterprise Architect. For BSIT capstones, draw.io is the most commonly used free tool.
How detailed does the ER diagram need to be for capstone defense?
Panel members expect the diagram to match the actual system implementation. Include every major class/use case/entity relevant to the system. Omit trivial helper classes. Every diagram element should have a clear justification. Aim for 1-2 diagrams that fully cover the system, not many partial ones.
Should I use black-and-white or colored diagrams?
Black-and-white is standard for capstone documentation to match the thesis format. Use color only if it improves clarity (e.g., grouping subsystems). Ensure text is readable at printed size (10pt minimum for labels).
Where does this diagram go in the capstone documentation?
Chapter 3 (System Design and Methodology) typically holds all UML diagrams. Introduce each diagram with a 1-paragraph description explaining what it shows and how to read it. Reference specific elements in the surrounding text so panel members can follow the design rationale.
Frequently asked questions
What is a ER diagram used for in BSIT capstone?
An ER diagram shows the database schema: entities (tables), attributes (columns), and relationships (foreign keys, cardinality). It goes in Chapter 3 alongside the class diagram to communicate the data storage design.
What tool should I use to draw the ER diagram?
Free options: draw.io, Lucidchart free tier, PlantUML, StarUML 30-day trial, Visual Paradigm Community Edition. Paid options: Microsoft Visio, Lucidchart pro, Enterprise Architect. For BSIT capstones, draw.io is the most commonly used free tool.
How detailed does the ER diagram need to be for capstone defense?
Panel members expect the diagram to match the actual system implementation. Include every major class/use case/entity relevant to the system. Omit trivial helper classes. Every diagram element should have a clear justification.
Should I use black-and-white or colored diagrams?
Black-and-white is standard for capstone documentation to match the thesis format. Use color only if it improves clarity. Ensure text is readable at printed size (10pt minimum for labels).
Where does this diagram go in the capstone documentation?
Chapter 3 (System Design and Methodology) typically holds all UML diagrams. Introduce each diagram with a 1-paragraph description explaining what it shows and how to read it.
Thank you so much fir wonderful time & support