

The DFD for Doctor Appointment System is the overall flow of data on the project. It is used to document the transformation of data (input-output) for project development.
This doctor appointment system DFD consists of DFD levels 0, 1, and 2. It also uses entities, processes, and data to define the whole system.
What is Doctor Appointment System DFD?
The DFD (data flow diagram) is a method which use for doctor appointment system development. It represents the system major processes and alternatives that generate the internal flow of project management.
Additionally, the data stores properly in categorized to illustrate the doctor appointment system structure. Take note that DFD is not part of the Doctor Appointment, but they complement each other in explaining the project activities, behaviors, interactions, and structure.
Details of Data Flow Diagram for Doctor Appointment System
The table shows the overview and details of the data flow diagram of the system. It has complete information about the project.
| Name: | Doctor Appointment System (DFD) Data Flow Diagram |
| Abstract: | The doctor appointment management system data flow diagram (DFD) shows the structure of the project in terms of its data management. It contains the important details on the flow of data and alternatives done in the project. |
| Diagram: | Data Flow Diagram (DFD) |
| Users: | Hospital admin, Physicians, and Patients. |
| Tools Used: | You may use any Diagram tools that provide data flow diagram symbols. |
| Designer: | ITSourceCode.com |
Free tool
Generate this Data Flow Diagram in 3 minutes
You have the structure. Now build it with your own entities. The Booking / Reservation template comes pre-filled, so you rename what does not match your project and export straight into your Chapter 3.
Open the Booking / Reservation template →3 free diagrams every week. No credit card needed.
Importance of Data Flow Diagram (DFD)
The importance of the data flow diagram for doctor appointment system is to show the developers the actual happenings in the system. This is done by visualizing the system’s data management at various levels.
Doctor Appointment System Data Flow Diagram
A thorough explanation is provided for the example data flow diagram for doctor appointment system. This example emphasizes the three DFD levels (DFD Levels 0, 1, and 2).
0 Level DFD for Doctor Appointment System
The context diagram is an alternative name for the Level 0 Data flow Diagram for Doctor Appointment System. Users, the main process, and data flow make up its parts. Also, the project concept is demonstrated using the single process visualization.
DFD Level 0 shows the entities that interact with a system and defines the border between the system and its environment. This diagram also depicts the doctor appointment system at a high level.
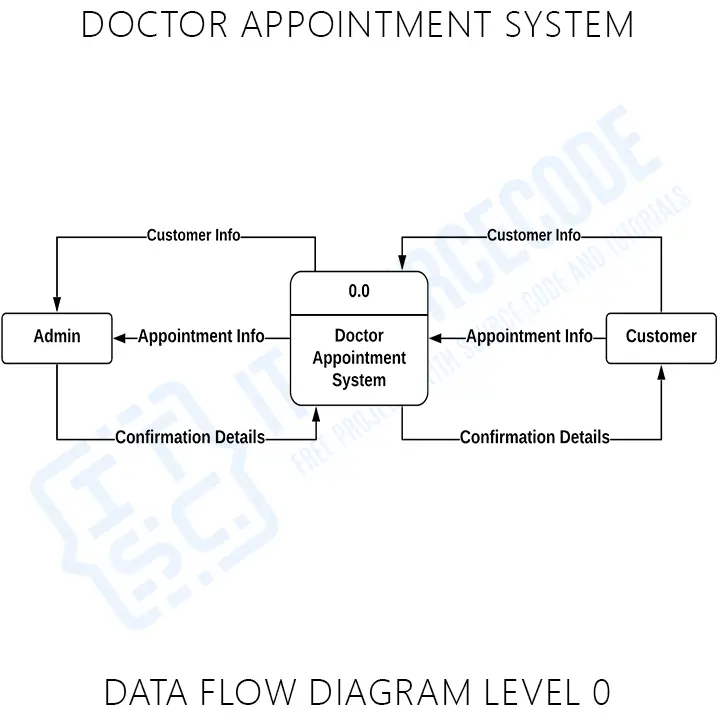
The illustration presents the main process in a single node to introduce the project context. This context explains how the project works in just one look. The user feeds data into the system and then receives the output from it.
Level 1 DFD for Doctor Appointment System
The “detonated view” of the context diagram is Doctor Appointment System Data flow diagram Level 1. Its function is to deepen the concept derive from the context diagram.
Specifically, level 1 shows the broader details of Doctor Appointment System Level 0. This is to clarify the paths (flow) of data and its transformation from input to output.
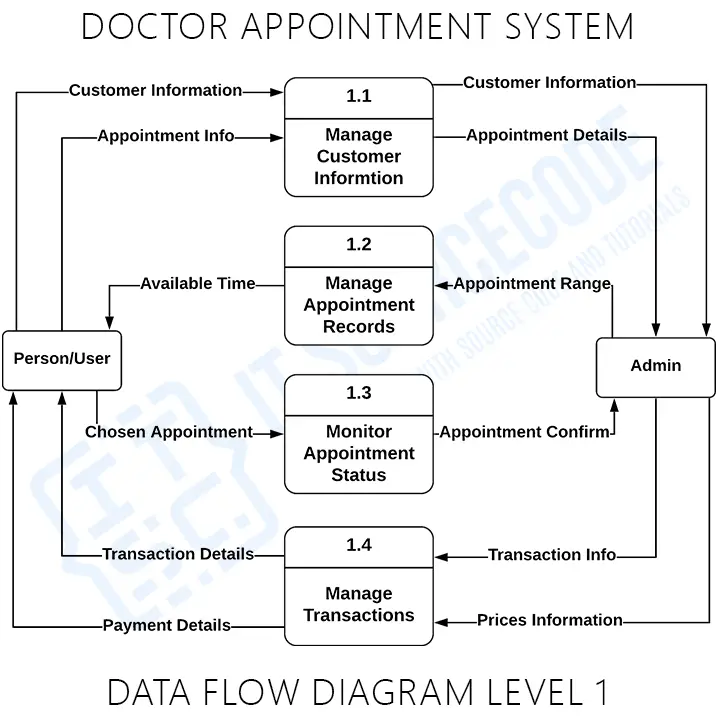
The designed diagram portrays four different scenarios: customer information management, appointment records management, appointment status monitoring, and transactions management.
DFD Level 2 for Doctor Appointment System
Level 2 Data flow diagram for Doctor Appointment System is also the highest abstraction of the data flow diagram. This level also broadens the idea from the DFD level 1. It includes the sub-processes from level 1 as well as the data that flows.
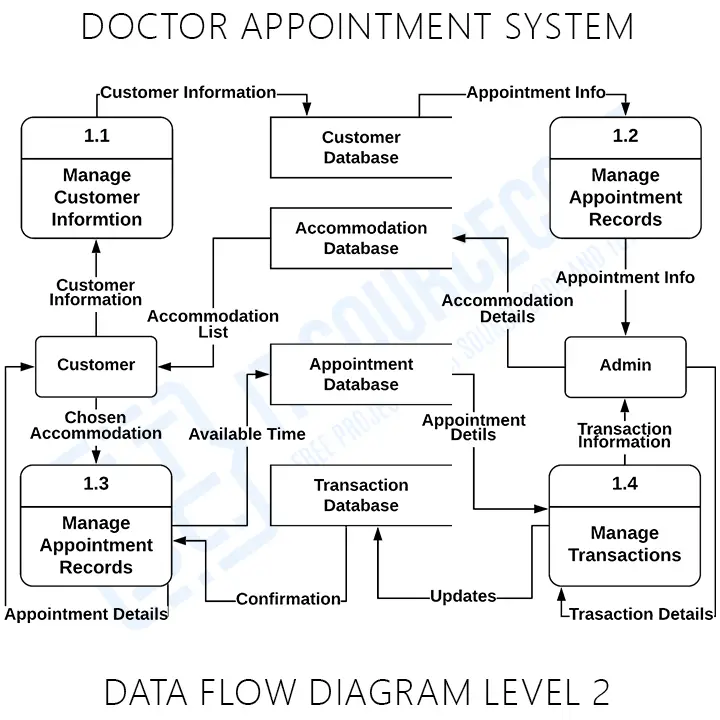
However, not all of the processes in the project must have sub-processes. Only provide this diagram if needed. As long as your previous diagrams were clear and precise, this level is not required.
Doctor Appointment System Data Flow Diagram Pdf
You may download the Data Flow Diagram for Doctor Appointment System PDF by clicking the button below. It has the full details and discussion of the System’s Data Flow Diagram. You can also modify its content to complete your project requirements and needs.
Data Flow Diagram Notations:
To define the data flow diagram, we used DFD notations. They were presented in symbols to be understood easily. The symbols present the following:
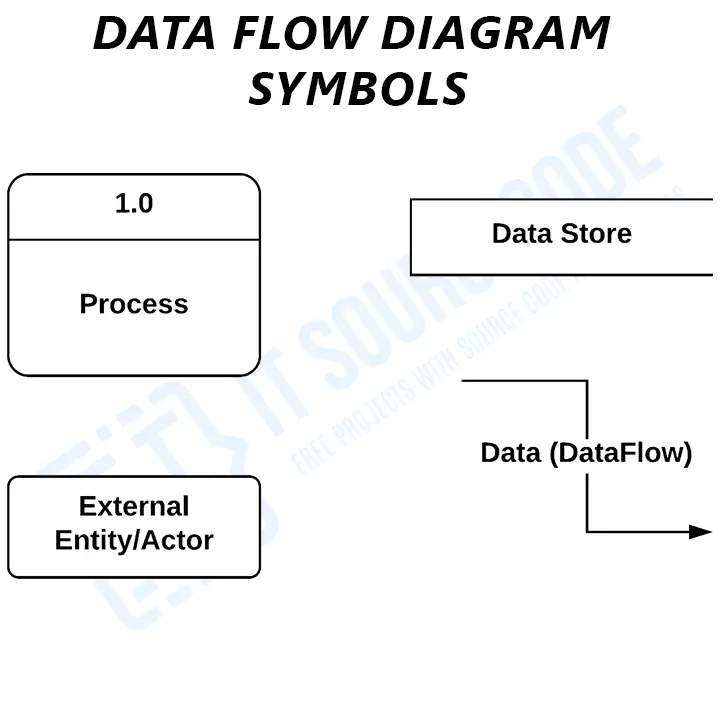
These data flow diagram notations represent the total data handling. Using these Data Flow Diagram symbols would also help to draw attention to the system’s architecture in a simpler way.
Conclusion
In conclusion, we have discussed the things that we need to know to create a data flow diagram. Its main purpose is to emphasize the transformation of data from input to output. Along with this, DFD levels were very useful in elaborating the system.
Related Articles:
- DFD for Login and Registration
- DFD for Hotel Reservation System
- Railway Reservation System DFD
- DFD Diagram for ATM System
- Purchase Management System DFD
- Sales and Inventory System DFD
Inquiries
If you have inquiries or suggestions about DFD Diagram for Doctor Appointment System, just leave us your comments below. We would be glad to hear to concerns and suggestions and be part of your learning.
How to read a data flow diagram
A DFD shows how data moves through the system. Unlike UML, DFD is not part of the UML standard but is standard in structured analysis and BSIT capstone documentation.
- Process. Circle or rounded rectangle representing a transformation of data.
- Data store. Open-ended rectangle or two parallel lines representing persistent storage.
- External entity. Rectangle outside the system representing a source or destination of data (users, external systems).
- Data flow. Arrow labeled with the data being moved.
DFD levels
- Level 0 (Context diagram). The entire system as a single process, with all external entities and the data they exchange.
- Level 1. Explodes the context process into 3-7 major sub-processes, still connected to the external entities.
- Level 2. Further decomposes each Level 1 process into detailed sub-processes.
- Level 3+. Rarely needed. Only for very complex systems.
Common capstone mistakes to avoid
- Skipping Level 0. Always start with the context diagram.
- Process with no output. Every process must produce data.
- Data flow between two external entities. Data flows must involve at least one process.
- Unbalanced levels. The inputs and outputs at Level N must match those at Level N-1.
- Missing data store labels. Every data store needs a name (usually the corresponding database table).
Where the DFD fits in Chapter 3
- Section 3.2 (System Analysis). Usually before the class or ER diagram.
- Include all levels 0-2 for a complete decomposition.
- Number each process (1.0, 1.1, 1.2, etc.) for easy reference.
Official documentation
Working source code for this system
Download the actual implementation of this system in your preferred language. Each project includes source code, database, and setup instructions for BSIT capstone use.
Frequently asked questions
What is a data flow diagram used for in BSIT capstone?
A data flow diagram shows how data moves through the system: processes, data stores, external entities, and data flows. Level 0 (context) shows the whole system as one process; Level 1 breaks it into major sub-processes; Level 2 details each sub-process.
What tool should I use to draw the data flow diagram?
Free options: draw.io (browser-based, saves to Google Drive), Lucidchart free tier, PlantUML (text-based, version-controllable), StarUML (30-day trial then reduced feature set), Visual Paradigm Community Edition. Paid options: Microsoft Visio, Lucidchart pro, Enterprise Architect. For BSIT capstones, draw.io is the most commonly used free tool.
How detailed does the data flow diagram need to be for capstone defense?
Panel members expect the diagram to match the actual system implementation. Include every major class/use case/entity relevant to the system. Omit trivial helper classes. Every diagram element should have a clear justification. Aim for 1-2 diagrams that fully cover the system, not many partial ones.
Should I use black-and-white or colored diagrams?
Black-and-white is standard for capstone documentation to match the thesis format. Use color only if it improves clarity (e.g., grouping subsystems). Ensure text is readable at printed size (10pt minimum for labels).
Where does this diagram go in the capstone documentation?
Chapter 3 (System Design and Methodology) typically holds all UML diagrams. Introduce each diagram with a 1-paragraph description explaining what it shows and how to read it. Reference specific elements in the surrounding text so panel members can follow the design rationale.

Mary Grace G. Patulada
Programmer & Technical Writer at PIES IT Solution
Mary Grace G. Patulada (pen name ‘Nym’) is a programmer and writer at PIES IT Solution with a BSIT background from Carlos Hilado Memorial State College, Binalbagan Campus. Authored 370+ UML diagram tutorials and capstone documentation guides at itsourcecode.com. Specializes in UML (class, use case, activity, sequence, component, deployment), DFD, and ER diagrams for BSIT capstone projects.
Expertise: UML Diagrams · DFD · ER Diagrams · Use Case Diagrams · Activity Diagrams · Capstone Documentation · PHP
· View all posts by Mary Grace G. Patulada →