
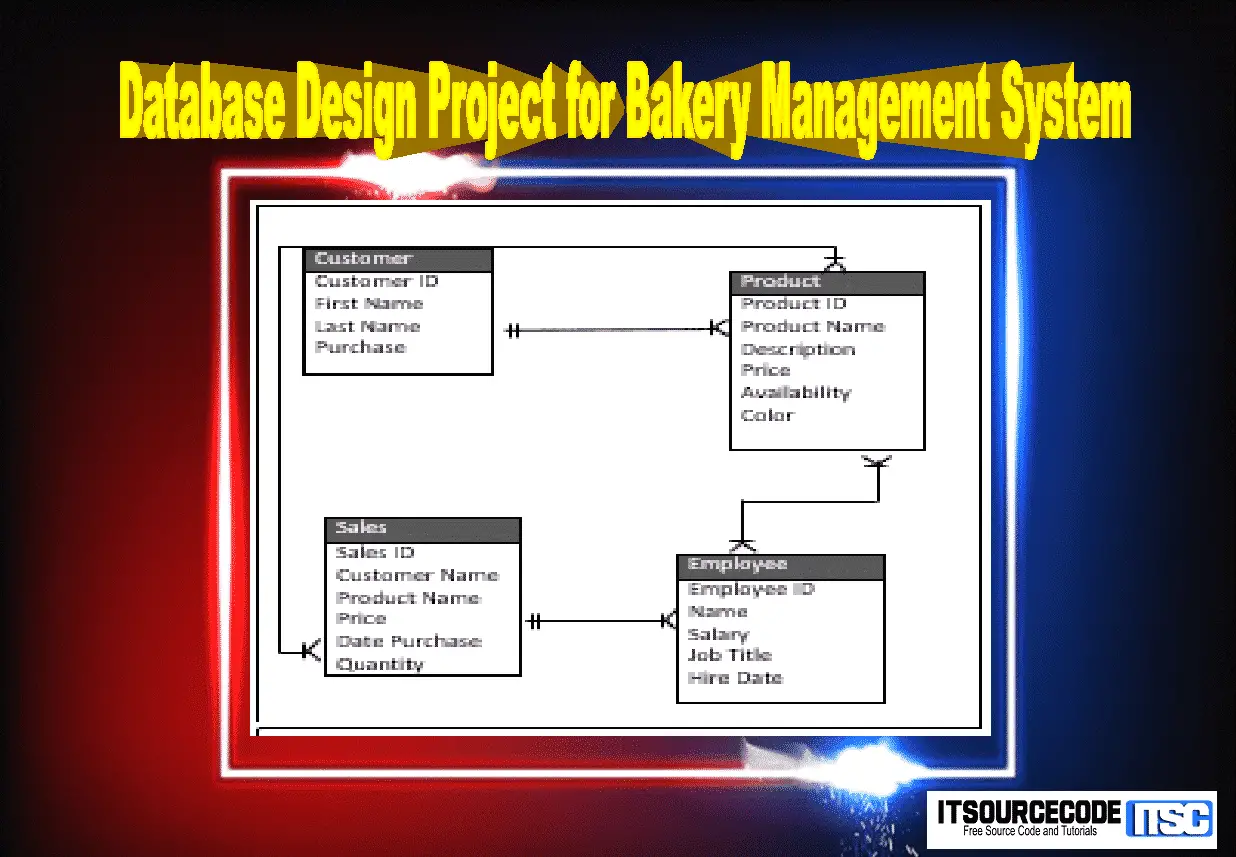
Database Design Project for Bakery Management System
This article of Database Design Project for Bakery Management System or Bakery Management System Database Design with ERD help to minimize the work of employee in the shop.
These system tackles the shop challenges in one integrated system, meeting your inventory, processing, distributing and accounting needs(Database Design for Bakery Management System with Tables).
The project is about making a database for the bakery management system to make the record of the employees, purchase, product, customer or retailer.
It is built to store all the information of products, handling employee information, easy search for products, feedback directly, creating and managing inventory.
The basic aim of these project is to provide the search, delete, record and updating facilities which would be much more efficient and less time consuming.
The software will allow the owner to maintain their entire record in one place which will be easy to manage(Database Design for Bakery Management System with Tables).
And these project comprise of the list of all product display with different classification able to the owner be aware to the product availability.
The Glady’s Bakery Management System was establish in the year 2000, month of March by Glady Mae Escotal and family.
These is located in Brgy. Magballo, Kabankalan City.
These shop compose of five employee, two for cashiering and managing the shop, two for baking and one for maintaining the shop clean( Bakery Management System Database Design with ERD ).
Features
- Make the transaction faster
- Reach the customer satisfaction
- Purchase and Inventory Control
- Managing the flow of transaction between the customer and employee
- Record all the details of the product
Database Dictionaries
Table 1: tblcustomer
| Field Name | Description | Type | Length |
| Customer_ID | Customer ID number |
int | 10 |
| Fname | Customer Fname | Varchar | 10 |
| Lname | Customer Lname | Varchar | 10 |
| Purchase Product | Product Purchase of the Customer |
Varchar | 10 |
Table 2: tblproduct
| Field Name | Description | Type | Length |
| Product_ID | Product ID number | int | 10 |
| Product Name | Name of the Product | Varchar | 10 |
| Color | Product Color | Varchar | 10 |
| Description | The Description of the Product |
Text |
30 |
| Price |
Price of the Product |
int |
10 |
| Availability | Number of Product | int | 10 |
| Size | Size of the Product | int | 10 |
Table 3: tblemployee
| Field Name | Description | Type | Length |
| Employee_ID |
Employee ID Number |
int |
10 |
|
Name |
Name of the Employee |
Varchar |
30 |
|
Salary |
Monthly salary of employee |
Int |
10 |
| Job Title | Assigned Work | Varchar | 30 |
| Hire Date | Date when Employee Hired |
int |
10 |
Table 4: tblsales
| Field Name | Description | Type | Length |
| Sales_ID | Sales ID number | int | 10 |
| Customer Name |
Name of the Customer |
Varchar | 15 |
| Product Name |
Name of the Product |
Varchar | 15 |
| Price |
Price of the Product | int | 10 |
| Date Purchase |
Date of the Transaction |
int |
10 |
| Quantity |
Number of item purchase |
int |
10 |
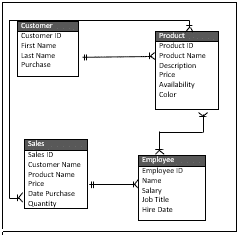
Entity Relationship Diagram
For More Database Design Examples
- ER Diagram for Sales and Inventory System Database Design
- Ordering System Database Design with ERD
- ER Diagram for Water Refilling Station System Database Design
- Database Design for High School Enrollment System
- Database Design for Customer Management System
How to read an ER diagram
An entity-relationship (ER) diagram documents the database schema: entities (tables), attributes (columns), and relationships (foreign keys and cardinality).
- Entity. Rectangle representing a table.
- Attribute. Oval or field for each column.
- Primary key. Underlined attribute name.
- Foreign key. Attribute referencing another entity.
- Relationship. Diamond or line connecting related entities.
Common capstone mistakes to avoid
- Many-to-many without junction table.
- Missing primary key.
- Denormalized redundancy.
- Ambiguous naming.
Where this diagram fits in Chapter 3
- Section 3.3 (Database Design).
- Include the CREATE TABLE SQL script alongside.
- Reference from the class diagram.
- Include a legend to explain the notation for panel members.
Official documentation
Official documentation
Working source code for this system
Download the actual implementation of this system in your preferred language. Each project includes source code, database, and setup instructions for BSIT capstone use.
Frequently asked questions
What is a ER diagram used for in BSIT capstone?
An ER diagram shows the database schema: entities (tables), attributes (columns), and relationships (foreign keys, cardinality). It goes in Chapter 3 alongside the class diagram to communicate the data storage design.
What tool should I use to draw the ER diagram?
Free options: draw.io, Lucidchart free tier, PlantUML, StarUML 30-day trial, Visual Paradigm Community Edition. Paid options: Microsoft Visio, Lucidchart pro, Enterprise Architect. For BSIT capstones, draw.io is the most commonly used free tool.
How detailed does the ER diagram need to be for capstone defense?
Panel members expect the diagram to match the actual system implementation. Include every major class/use case/entity relevant to the system. Omit trivial helper classes. Every diagram element should have a clear justification.
Should I use black-and-white or colored diagrams?
Black-and-white is standard for capstone documentation to match the thesis format. Use color only if it improves clarity. Ensure text is readable at printed size (10pt minimum for labels).
Where does this diagram go in the capstone documentation?
Chapter 3 (System Design and Methodology) typically holds all UML diagrams. Introduce each diagram with a 1-paragraph description explaining what it shows and how to read it.
Frequently asked questions
What is a ER diagram used for in BSIT capstone?
An ER diagram shows the database schema: entities (tables), attributes (columns), and relationships (foreign keys, cardinality). It goes in Chapter 3 alongside the class diagram to communicate the data storage design.
What tool should I use to draw the ER diagram?
Free options: draw.io (browser-based, saves to Google Drive), Lucidchart free tier, PlantUML (text-based, version-controllable), StarUML (30-day trial then reduced feature set), Visual Paradigm Community Edition. Paid options: Microsoft Visio, Lucidchart pro, Enterprise Architect. For BSIT capstones, draw.io is the most commonly used free tool.
How detailed does the ER diagram need to be for capstone defense?
Panel members expect the diagram to match the actual system implementation. Include every major class/use case/entity relevant to the system. Omit trivial helper classes. Every diagram element should have a clear justification. Aim for 1-2 diagrams that fully cover the system, not many partial ones.
Should I use black-and-white or colored diagrams?
Black-and-white is standard for capstone documentation to match the thesis format. Use color only if it improves clarity (e.g., grouping subsystems). Ensure text is readable at printed size (10pt minimum for labels).
Where does this diagram go in the capstone documentation?
Chapter 3 (System Design and Methodology) typically holds all UML diagrams. Introduce each diagram with a 1-paragraph description explaining what it shows and how to read it. Reference specific elements in the surrounding text so panel members can follow the design rationale.

Mary Grace G. Patulada
Programmer & Technical Writer at PIES IT Solution
Mary Grace G. Patulada (pen name ‘Nym’) is a programmer and writer at PIES IT Solution with a BSIT background from Carlos Hilado Memorial State College, Binalbagan Campus. Authored 370+ UML diagram tutorials and capstone documentation guides at itsourcecode.com. Specializes in UML (class, use case, activity, sequence, component, deployment), DFD, and ER diagrams for BSIT capstone projects.
Expertise: UML Diagrams, DFD, ER Diagrams, Use Case Diagrams, Activity Diagrams, Capstone Documentation, PHP · View all posts by Mary Grace G. Patulada →