
A Database Design for Clinic Management System is the final requirements in Database management system 1 subject.
The system for this database design will be created using JAVA NETBEANS IDE. Clinic Management System is the one who can manage all the records of the check-up, patients, treatments, medicines, and equipment.
And the main purpose of Clinic Management System is to maintain the details of the patients and make data retrieval easy and efficient.
Entity Relationship Diagram of Clinic Management System
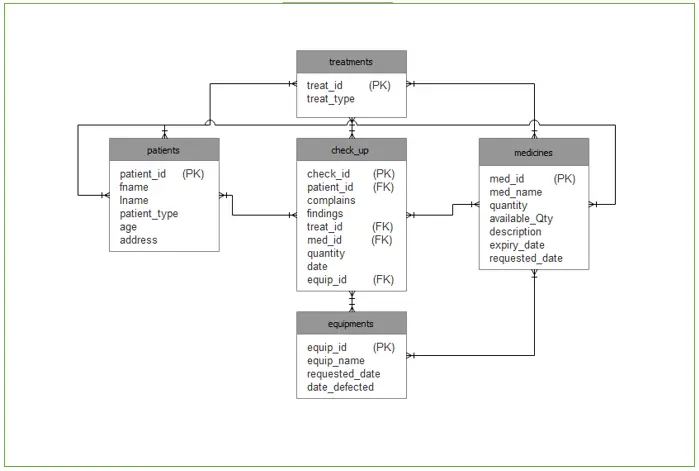
The clinic management System has 5 table, first the check-up table, this table we can manage all the records of all patient in there check up id number, complains, findings the treatment that given to the patient the medicine that given to the patient and the quantity of medicine that take of the patient and also the date when the patient undergo check-up.
The second table is the patient’s table, this table we can manage all the information of the patient, the patient id number, first name, last name, patient type, age and address of the patient.
The third table is treatments table, this table has two attributes, the treatment_id, and the treatment_type if what type of treatment that have given to the patient.
The fourth table is medicines table, this table contains all the record of the medicines,the medicine id,medicine name,quantity of the medicine if how many stock do you input in one medicine,available quantity if how many available quantity in that medicine,description if for what sickness that medicine, expiry date if what date of the medicine expired and last the requested date if what date do you request for that medicine.
The fifth table is the equipment table, this table contains all the record of the equipment, the equipment table has four attributes first the equip_id or the equipment id, second is equip_name or equipment name, third is requested_date and last the date defected of the equipment.
Features:
- Manage patients
- Manage check-up
- Manage Treatments
- Manage medicines
- Manage equipment
- Medicines Inventory
This database design is designed by Reyes Suarez Jude
Data Dictionaries:
Table1: check_up
| FIELD NAME | DESCRIPTION | TYPE | LENGTH |
| check_id | Check-up id number | INT | 11 |
| patient_id | Patient id number | INT | 11 |
| complains | Complains of the patient | TEXT |
|
| findings | finding of patient | TEXT | |
| treat_id | Treatment id number | INT | 11 |
| med_id | Medicine id number | INT | 11 |
| quantity | Quantity of medicine | INT | 11 |
| date | Date of check-up | DATE |
Table2: patients
| FIELD NAME | DESCRIPTION | TYPE | LENGTH |
| patient_id | Patient id number | INT | 11 |
| fname | First name of patient | VARCHAR | 64 |
| lname | Last name of patient | VARCHAR | 64 |
| patient_type | Type of patient | VARCHAR | 64 |
| age | Age of patient | INT | 2 |
| address | Address of patient | TEXT |
Table3:treatments
| FIELD NAME | DESCRIPTION | TYPE | LENGTH |
| treat_id | Treatment id number | INT | 11 |
| treat_type | Type of treatment | VARCHAR | 64 |
Table4:medicines
| FIELD NAME | DESCRIPTION | TYPE | LENGTH |
| med_id | Medicine id number | INT | 11 |
| med_name | Name of medicine | VARCHAR | 64 |
| quantity | Quantity of medicine added | INT | 11 |
| available_Qty | Available quantity of medicine | INT | 11 |
| description | Description of medicine | TEXT | |
| expiry_date | Expiry date of medicine | DATE | |
| requested_date | Requested date of medicine | DATE |
Table5:equipments
| FIELD NAME | DESCRIPTION | TYPE | LENGTH |
| equip_id | Equipment id number | INT | 11 |
| equip_name | Equipment name | VARCHAR | 64 |
| requested_date | Equipment requested date | DATE | |
| date_defected | Equipment date defected | DATE |
If you have any questions or suggestions, please contact us.
How to read an ER diagram
An entity-relationship (ER) diagram documents the database schema: entities (tables), attributes (columns), and relationships (foreign keys and cardinality).
- Entity. Rectangle representing a table.
- Attribute. Oval or field for each column.
- Primary key. Underlined attribute name.
- Foreign key. Attribute referencing another entity.
- Relationship. Diamond or line connecting related entities.
Common capstone mistakes to avoid
- Many-to-many without junction table.
- Missing primary key.
- Denormalized redundancy.
- Ambiguous naming.
Where this diagram fits in Chapter 3
- Section 3.3 (Database Design).
- Include the CREATE TABLE SQL script alongside.
- Reference from the class diagram.
- Include a legend to explain the notation for panel members.
Official documentation
Official documentation
Working source code for this system
Download the actual implementation of this system in your preferred language. Each project includes source code, database, and setup instructions for BSIT capstone use.
- PHP: Hospital Management System Project In PHP With Source Code
- VB.NET: Hospital Management System Database Design
- Java: Project On Hospital Management System In Java Source Code
- Python: Django Online Medical Management System with Source Code
- Django: Django Online Medical Management System with Source Code
- Laravel: Clinic Management System Project in Laravel with Source Code
Frequently asked questions
What is a ER diagram used for in BSIT capstone?
An ER diagram shows the database schema: entities (tables), attributes (columns), and relationships (foreign keys, cardinality). It goes in Chapter 3 alongside the class diagram to communicate the data storage design.
What tool should I use to draw the ER diagram?
Free options: draw.io, Lucidchart free tier, PlantUML, StarUML 30-day trial, Visual Paradigm Community Edition. Paid options: Microsoft Visio, Lucidchart pro, Enterprise Architect. For BSIT capstones, draw.io is the most commonly used free tool.
How detailed does the ER diagram need to be for capstone defense?
Panel members expect the diagram to match the actual system implementation. Include every major class/use case/entity relevant to the system. Omit trivial helper classes. Every diagram element should have a clear justification.
Should I use black-and-white or colored diagrams?
Black-and-white is standard for capstone documentation to match the thesis format. Use color only if it improves clarity. Ensure text is readable at printed size (10pt minimum for labels).
Where does this diagram go in the capstone documentation?
Chapter 3 (System Design and Methodology) typically holds all UML diagrams. Introduce each diagram with a 1-paragraph description explaining what it shows and how to read it.
Frequently asked questions
What is a ER diagram used for in BSIT capstone?
An ER diagram shows the database schema: entities (tables), attributes (columns), and relationships (foreign keys, cardinality). It goes in Chapter 3 alongside the class diagram to communicate the data storage design.
What tool should I use to draw the ER diagram?
Free options: draw.io (browser-based, saves to Google Drive), Lucidchart free tier, PlantUML (text-based, version-controllable), StarUML (30-day trial then reduced feature set), Visual Paradigm Community Edition. Paid options: Microsoft Visio, Lucidchart pro, Enterprise Architect. For BSIT capstones, draw.io is the most commonly used free tool.
How detailed does the ER diagram need to be for capstone defense?
Panel members expect the diagram to match the actual system implementation. Include every major class/use case/entity relevant to the system. Omit trivial helper classes. Every diagram element should have a clear justification. Aim for 1-2 diagrams that fully cover the system, not many partial ones.
Should I use black-and-white or colored diagrams?
Black-and-white is standard for capstone documentation to match the thesis format. Use color only if it improves clarity (e.g., grouping subsystems). Ensure text is readable at printed size (10pt minimum for labels).
Where does this diagram go in the capstone documentation?
Chapter 3 (System Design and Methodology) typically holds all UML diagrams. Introduce each diagram with a 1-paragraph description explaining what it shows and how to read it. Reference specific elements in the surrounding text so panel members can follow the design rationale.

Joken E. Villanueva
Founder & Lead Developer at PIES IT Solution
Founder of PIES Information Technology Solutions, a software company building production-grade applications for institutions across the Philippines. Over 8 years of hands-on full-stack development experience, currently leading the development of ClinicAI, an AI-powered clinic management platform.
Expertise: PHP · MySQL · JavaScript · AI Integration · SaaS Architecture · VB.NET · Database Design · Capstone Documentation · Java
· View all posts by Joken E. Villanueva →