
Frozen Foods Ordering System Database Design
Frozen foods ordering system database design is a database used for business. The main purpose of this database project is to make the ordering transaction fast with accuracy, to keep and secure the order records, to avoid delay of pick- up of the ordered products and most especially, is to promote the products.
The following are the company’s goal in reaching the best service they can give to their valued customers. A direct customer is a customer that will call the company directly and place an order.
This type of client is usually an independent person, who orders small amounts and are unlikely to receive a discount on their purchases.
All profits on a sale made to direct customers, goes directly to the company, without dividing or sharing profits or paying commissions.
A wholesale customer is very similar to a direct customer. They also buy directly from the company but will buy meals in bulk and receive a discount on their purchases.
Frozen Foods Ordering System Database Design Features:
- Products (Add, View, Update)
- Orders (Confirm, Cancel)
- Manage Users (Add, List, Update)
- Customer Profile
- Product Purchases by Supplier
- Purchase Orders
- Employees profile
- Customer (direct customer, wholesale customer)
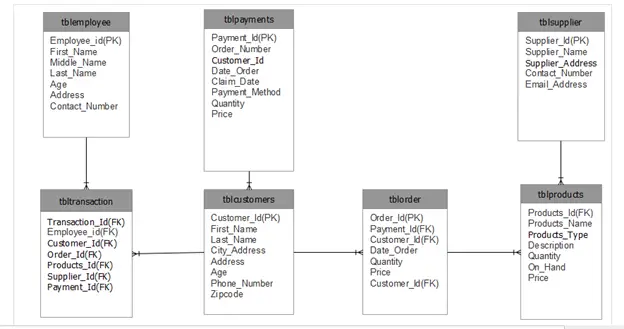
Entity Relationship Diagram of Frozen Foods Ordering System
In relational databases, all the required data is collected and divided into selected tables. This is to ensure that the data is stored in an organized manner, which will make it easier to track through records in the database.
This eliminates the problems often encountered when all the information is written in a single line or record, or when all information is saved in a certain sheet, for example, an Excel spreadsheet.
After all the tables with their different information categories within the tables have been designed and populated within the tables, the tables are linked via relationships.
The relationships are established by a decided table primary key, which is present in the specific table, as well as present in another table, as a foreign key.
The relationship between two tables is illustrated by a line joining two or more of these tables. At the end of a joining line, the manner in which the two tables have been joined is also indicated.
This is visible in the diagram below and these manners include, one-to-one -, one-to-many – and many to many relationships.
Diagram of Ordering System
This form of data modeling was used to set the system requirements for the database that were determined throughout the project.
The ERD assisted the project team with the design of the IS and was used as a plan throughout the construction thereof. It served as a map which could be followed and was often referred to.
Data Dictionaries
Table 1: tblcustomers
| Field Name | Description | Type | Length |
| ID | Customer ID number | Int | 11 |
| Customer_id | Number of Customers | varchar | 90 |
| First_Name | FirstName of Customer | varchar | 90 |
| Last Name | LastName of Customer | varchar | 90 |
| City_address | Customer City Address | varchar | 90 |
| Address | Customer Full address | varchar | 90 |
| Age | Age of Customer | int | 2 |
| Phone number | Contact number 0f Customer | varchar | 11 |
| Zipcode | Customer city address zipcode | varchar | 11 |
Table 2: tblemployee
| Field Name | Description | Type | Length |
| Employee_id | Employee ID number | Int | 7 |
| First_Name | Employee Firstname | varchar | 50 |
| Middle Name | Employee Middle Name | varchar | 50 |
| Last Name | Employee Last Name | varchar | 50 |
| Age | Age of Employee | int | 2 |
| Address | Address of Employee | varchar | 50 |
| Contact_number | Contact Number of employee | varchar | 11 |
| Email_Address | Email Address of employee | varchar | 50 |
Table 3: tblorder
| Field Name | Description | Type | Length |
| Order_Id | Order ID number | Int | 7 |
| Products_id | Products ID number | int | 7 |
| Date_order | Date ordered of customer | varchar | 30 |
| Quantity | Customer suggested products | Int | 1 |
| Price | Price of the products | int | 11 |
| Date Claim | Claim date of customer | varchar | 30 |
| Order Type | Pick- up or cash on delivery | Date | 30 |
| Status | Available or not available | Date | 30 |
| Order_Number | Order number of products | varchar | 50 |
| Customer_Id | Customer ID number | int | 7 |
Table 4: tblpayments
| Field Name | Description | Type | Length |
| Payment_Id | Payment ID number | Int | 7 |
| Order_Number | Order number of products | varchar | 30 |
| Customer_Id | Customer Id number | Int | 7 |
| Date_Order | Date ordered of customer | Varchar | 30 |
| Claim_date | Claim date of customer | Int | 11 |
| Payment_Method | Payment method of customer | Varchar | 30 |
| Qty | Customer suggested products | Int | 1 |
| Price | Price of the products | int | 11 |
Table 5: tblproducts
| Field Name | Description | Type | Length |
| Products_Id | Products ID number | Int | 7 |
| Products_Name | Name of the Products | varchar | 90 |
| Product_Type | Types of Products | varchar | 90 |
| Description | Products description | Varchar | 90 |
| Quantity | Quantity of products | Varchar | 1 |
| On_Hand | Available or not available | Date | 1 |
| Price | Price of the products | Varchar | 11 |
Table 6: tblsupplier
| Field Name | Description | Type | Length |
| Supplier_Id | Supplier ID number | Int | 7 |
| Supplier_Name | Name of Supplier | varchar | 50 |
| Supplier_Address | Address of supplier | text | |
| Contact_number | Contact number of suppplier | Varchar | 11 |
| Email_Address | Email address of supplier | Varchar | 50 |
Table 7: tbltransactions
| Field Name | Description | Type | Length |
| Transaction_Id | transaction ID number | Int | 11 |
| Customer_Id | Customer id number | int | 7 |
| Employee_Id | Employees id number | int | 7 |
| Order_Id | Order id number | int | 7 |
| Products_Id | Products id number | int | 7 |
| Supplier_id | Supplier id number | int | 7 |
Table Keys
| Table Name | Fieldname | Key Type |
| tblemployee | Employee_Id | PK |
| tbltransaction | Transaction_Id | PK |
| tblcustomers | Customer_Id | PK |
| tblorders | Order_Id | PK |
| tblproducts | Products_Id | PK |
| tblsupplier | Supplier_Id | PK |
Table Keys
| Table Name | Fieldname | Key Type |
| tblemployee | Employee_Id | |
| tbltransaction | Transaction_Id | |
| tblcustomers | Customer_Id | FK |
| tblorders | Order_Id | FK |
| tblproducts | Products_Id | |
| tblsupplier | Supplier_Id |
This Frozen food ordering system Database design is created by
ADONES E. EVANGELISTA
Run Quick Virus Scan for secure Download
<a id="scan" class="classname">Run Quick Scan for secure Download</a>You can download Complete Source code with database design here: Online Ordering System
How to read an ER diagram
An entity-relationship (ER) diagram documents the database schema: entities (tables), attributes (columns), and relationships (foreign keys and cardinality).
- Entity. Rectangle representing a table.
- Attribute. Oval or field for each column.
- Primary key. Underlined attribute name.
- Foreign key. Attribute referencing another entity.
- Relationship. Diamond or line connecting related entities.
Common capstone mistakes to avoid
- Many-to-many without junction table.
- Missing primary key.
- Denormalized redundancy.
- Ambiguous naming.
Where this diagram fits in Chapter 3
- Section 3.3 (Database Design).
- Include the CREATE TABLE SQL script alongside.
- Reference from the class diagram.
- Include a legend to explain the notation for panel members.
Official documentation
Official documentation
Working source code for this system
Download the actual implementation of this system in your preferred language. Each project includes source code, database, and setup instructions for BSIT capstone use.
Frequently asked questions
What is a ER diagram used for in BSIT capstone?
An ER diagram shows the database schema: entities (tables), attributes (columns), and relationships (foreign keys, cardinality). It goes in Chapter 3 alongside the class diagram to communicate the data storage design.
What tool should I use to draw the ER diagram?
Free options: draw.io, Lucidchart free tier, PlantUML, StarUML 30-day trial, Visual Paradigm Community Edition. Paid options: Microsoft Visio, Lucidchart pro, Enterprise Architect. For BSIT capstones, draw.io is the most commonly used free tool.
How detailed does the ER diagram need to be for capstone defense?
Panel members expect the diagram to match the actual system implementation. Include every major class/use case/entity relevant to the system. Omit trivial helper classes. Every diagram element should have a clear justification.
Should I use black-and-white or colored diagrams?
Black-and-white is standard for capstone documentation to match the thesis format. Use color only if it improves clarity. Ensure text is readable at printed size (10pt minimum for labels).
Where does this diagram go in the capstone documentation?
Chapter 3 (System Design and Methodology) typically holds all UML diagrams. Introduce each diagram with a 1-paragraph description explaining what it shows and how to read it.
Frequently asked questions
What is a ER diagram used for in BSIT capstone?
An ER diagram shows the database schema: entities (tables), attributes (columns), and relationships (foreign keys, cardinality). It goes in Chapter 3 alongside the class diagram to communicate the data storage design.
What tool should I use to draw the ER diagram?
Free options: draw.io (browser-based, saves to Google Drive), Lucidchart free tier, PlantUML (text-based, version-controllable), StarUML (30-day trial then reduced feature set), Visual Paradigm Community Edition. Paid options: Microsoft Visio, Lucidchart pro, Enterprise Architect. For BSIT capstones, draw.io is the most commonly used free tool.
How detailed does the ER diagram need to be for capstone defense?
Panel members expect the diagram to match the actual system implementation. Include every major class/use case/entity relevant to the system. Omit trivial helper classes. Every diagram element should have a clear justification. Aim for 1-2 diagrams that fully cover the system, not many partial ones.
Should I use black-and-white or colored diagrams?
Black-and-white is standard for capstone documentation to match the thesis format. Use color only if it improves clarity (e.g., grouping subsystems). Ensure text is readable at printed size (10pt minimum for labels).
Where does this diagram go in the capstone documentation?
Chapter 3 (System Design and Methodology) typically holds all UML diagrams. Introduce each diagram with a 1-paragraph description explaining what it shows and how to read it. Reference specific elements in the surrounding text so panel members can follow the design rationale.

Joken E. Villanueva
Founder & Lead Developer at PIES IT Solution
Founder of PIES Information Technology Solutions, a software company building production-grade applications for institutions across the Philippines. Over 8 years of hands-on full-stack development experience, currently leading the development of ClinicAI, an AI-powered clinic management platform.
Expertise: PHP · MySQL · JavaScript · AI Integration · SaaS Architecture · VB.NET · Database Design · Capstone Documentation · Java
· View all posts by Joken E. Villanueva →
Hi po admin..paki help po ako sa system namin na E-commerce po using php, bootstrap, etc. .. Di ko po alam kung panu simulan eh.. Please.. Please po.. Thank you..
Btw, I’m ferdilyn..I’m 3rd year IT student..