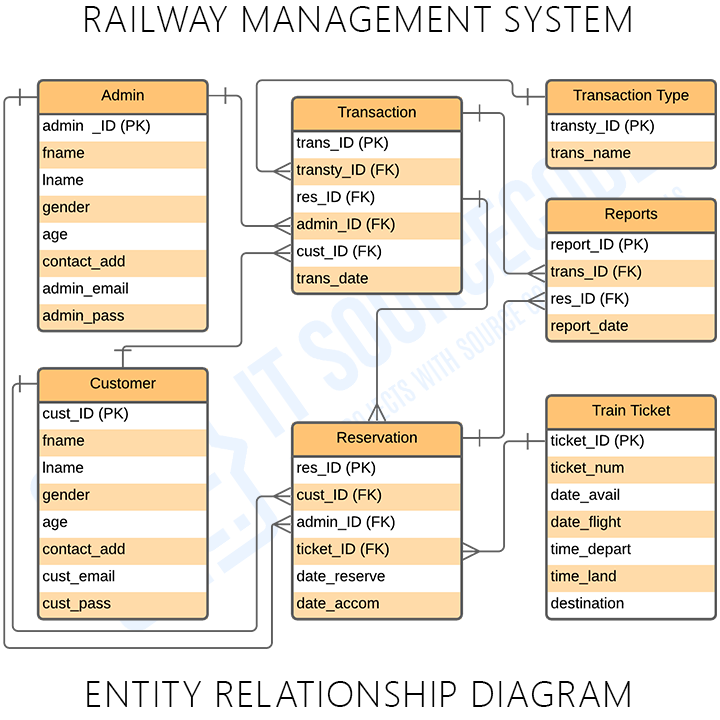
This ER (Entity Relationship) Diagram shows how the model of the Railway Management System ERD is put together. The entity-relationship diagram for the Railway Management System shows the visual parts of the database tables as well as the links between admin, customer, train ticket, transaction, transaction type reservation, and reports.
ER Diagram for Railway Management System: Details
The table shows the overall description of the ER Diagram for the Railway Management System. It has a complete overview of the project’s information.
| Name: | Railway Management System ER Diagram |
| Abstract: | It used structured data to show how the different groups of structured data in the Railway Management System fit together. The most important parts of the railway management system are the stations, admin, customer, train ticket, transaction, transaction type reservation, and reports. |
| Diagram: | ER Diagram is also known as Entity Relationship Diagram |
| Tools Used: | Diagraming tools that provide ER diagram symbols. |
| Users: | Train Companies, Passengers, and Crews. |
| Designer: | ITSourceCode.com |
What is Railway Management System?
A user may quickly handle customer information, booking information, and timetable information using the Railway Management System, an internet program. It is the computerized mechanism for making reservations for train seats in advance. It is primarily utilized on lengthy routes.
In both the short- and long-term, railway operators may boost performance and efficiency by putting the right positioning infrastructure in place.
Railway Management System Features
- Railway Management: Railway Management is the main feature of this system wherein the ER diagram contains the basic details needed for managing ticket records and availability. This basic information was composed of railway records, ticket sales, counts, and availabilities. It will also monitor or check the customers’ info and purchase or reservation status.
- Customer Management: This feature plays a big role in the system because it gathers and manages the customer’s important information. This information was used to keep track of their transactions, reservations, and other important system details to make sure that services were given correctly.
- The ticket management will be done by the admin to track the number of reserves and remaining available. This will also allow them to monitor the count of their customers as well as their revenues.
- Its features will enable you to manage and monitor your revenue while also securing each transaction. This is also the basis for their income and expenses. Through this, the admin will have the records of transactions and can review them for future use.
ER Diagram for Railway Reservation
The ER diagram of the Railway Management System shows the relationships between each system entity and how each entity is assumed to work in each relationship.
Railway Management System Database Design
This railway management system database design manages railway needs. Customer and user information can be encoded. Only the admin can view transaction details. Manage ticket and reservation info.
The system ER diagram featured security, management, status, and customer transactions. These features were also listed in reports tracking system transactions.
Railway Management System ER Diagram Tables
These tables include field names, descriptions, data types, and character lengths. Each table shows data storage attributes.
Table Name: Customer
| Field | Description | Type | Length |
| stud_ID (PK) | Customer ID | Int | 11 |
| fname | Customer First Name | Varchar | 255 |
| lname | Customer Last Name | Varchar | 255 |
| gender | Customer Gender | Int | 11 |
| age | Customer Age | Int | 11 |
| contact_add | Contact Address | Int | 11 |
| cust_email | Customer Email | Varchar | 255 |
| cust_pass | Customer Password | Varchar | 255 |
Table Name: Admin
| Field | Description | Type | Length |
| admin_ID (PK) | Admin ID | Int | 11 |
| fname | Admin First Name | Varchar | 255 |
| lname | Admin Last Name | Varchar | 255 |
| gender | Admin Gender | Int | 11 |
| age | Admin Age | Int | 11 |
| contact_add | Contact Address | Int | 11 |
| admin_email | Admin Email | Varchar | 255 |
| admin_pass | Admin Password | Varchar | 255 |
Table Name: Train Ticket
| Field | Description | Type | Length |
| ticket_ID (PK) | Ticket ID | Int | 11 |
| ticket_num | Ticket Number | Int | 11 |
| date_avail | Date Available | Date | |
| date_flight | Date of Flight | Date | |
| time_depart | Departure Time | Time | |
| time_land | Landing Time | Time | |
| destination | Destination | Varchar | 30 |
Table Name: Reservation
| Field | Description | Type | Length |
| res_ID (PK) | Reservation ID | Int | 11 |
| cust_ID (FK) | Customer ID | Int | 11 |
| admin_ID (FK) | Admin ID | Int | 11 |
| ticket_ID (FK) | Ticket ID | Int | 11 |
| date_reserve | Date Reservation | Date | |
| date_accom | Date of Accommodation | Date |
Table Name: Transaction
| Field | Description | Type | Length |
| trans_ID (PK) | Transaction ID | Int | 11 |
| trans_name | Transaction Name | Varchar | 30 |
| borrowing_ID (FK) | Subject ID | Int | 11 |
| stud_ID (FK) | Student ID | Int | 11 |
| trans_date | Date of Transaction | Date |
Table Name: Transaction Type
| Field | Description | Type | Length |
| transty_ID (PK) | Transaction Type ID | Int | 11 |
| trans_name | Transaction Type | Varchar | 30 |
Table Name: Reports
| Field | Description | Type | Length |
| report_ID (PK) | Report ID | Int | 11 |
| trans_ID (FK) | Transaction ID | Int | 11 |
| res_ID (FK) | Reservation ID | Int | 11 |
| report_date | Report Date | Date |
The tables will help developers create the RMS database. It contains the whole database description and will be entered into the program or data storage along with the table names. They’ll establish a database with attributes and values.
Railway Management System ER Diagram [PDF]
ER Diagram for Railway Management System in DBMS Pdf explains database fundamentals. Use this for your capstone project. You can adjust its content to fit your project’s needs.
How to create an Entity-Relationship (ER) Diagram
Time needed: 5 minutes
Here are the steps on how to create Railway Management System ER Diagram with Cardinality Ratio.
- Step 1: Become acquainted with the ER Diagram (Entity Relationship Diagram). Symbols and Cardinality
The Entity Relationship Diagram shows the structure of data types in a project. It uses symbols to clarify its parts and relationships. Their symbols and applications must be familiar before you build the ER Diagram.
ER Diagram Symbols:
Fields are the parts of a table that define the entity’s characteristics. In the database that the ERD models, attributes are commonly thought of as rows.
Keys are a technique to categorize data quality. It is used to organize ER diagrams and assist users in modeling their databases to ensure that they are efficient. This is also used to connect different tables in a database.
A primary key identifies a single entity instance, which means a unique attribute or set of attributes.
A foreign key is produced when data attributes have one too many relationships with other entities. - Step 2: Complete the entities that will be included.
Begin designing your ER Diagram by finalizing your railway reservation system’s entities. These are rectangles. You must leave room in future phases so they can be incorporated.
- Step 3: Add the attributes of each entity
Upon finalizing the entities, analyze their attributes. As characteristics, ER diagram entities are described. All these are characteristics. Multivalued characteristics have several values.
- Step 4: Describe the relationships (cardinality) between entities and attributes
Entities, characteristics, and relationships are needed to draw ERD relationships. The data structure and entity relationship diagram are based on evaluated information.
Conclusion:
ER (entity-relationship) diagram is used to build and develop RMS. Your diagrams will help you present your ideas and skills.
ER diagrams let you see the software’s back end, which holds all incoming and outgoing data. Read the suggested articles below to learn more about ER Diagrams.
Related Articles:
- Employee Management System ER Diagram
- Payroll Management System ER Diagram
- ER Diagram for Movie Ticket Booking System
- Car Rental System ER Diagram
- Pharmacy Management System ER Diagram
Inquiries
Leave questions or comments about the Railway Management System ER Diagram below. We’d love to hear your complaints and recommendations to help you learn.
Keep us updated and Good day!
Official documentation
Working source code for this system
Download the actual implementation of this system in your preferred language. Each project includes source code, database, and setup instructions for BSIT capstone use.
Frequently asked questions
What is a ER diagram used for in BSIT capstone?
An ER diagram shows the database schema: entities (tables), attributes (columns), and relationships (foreign keys, cardinality). It goes in Chapter 3 alongside the class diagram to communicate the data storage design.
What tool should I use to draw the ER diagram?
Free options: draw.io (browser-based, saves to Google Drive), Lucidchart free tier, PlantUML (text-based, version-controllable), StarUML (30-day trial then reduced feature set), Visual Paradigm Community Edition. Paid options: Microsoft Visio, Lucidchart pro, Enterprise Architect. For BSIT capstones, draw.io is the most commonly used free tool.
How detailed does the ER diagram need to be for capstone defense?
Panel members expect the diagram to match the actual system implementation. Include every major class/use case/entity relevant to the system. Omit trivial helper classes. Every diagram element should have a clear justification. Aim for 1-2 diagrams that fully cover the system, not many partial ones.
Should I use black-and-white or colored diagrams?
Black-and-white is standard for capstone documentation to match the thesis format. Use color only if it improves clarity (e.g., grouping subsystems). Ensure text is readable at printed size (10pt minimum for labels).
Where does this diagram go in the capstone documentation?
Chapter 3 (System Design and Methodology) typically holds all UML diagrams. Introduce each diagram with a 1-paragraph description explaining what it shows and how to read it. Reference specific elements in the surrounding text so panel members can follow the design rationale.

Mary Grace G. Patulada
Programmer & Technical Writer at PIES IT Solution
Mary Grace G. Patulada (pen name ‘Nym’) is a programmer and writer at PIES IT Solution with a BSIT background from Carlos Hilado Memorial State College, Binalbagan Campus. Authored 370+ UML diagram tutorials and capstone documentation guides at itsourcecode.com. Specializes in UML (class, use case, activity, sequence, component, deployment), DFD, and ER diagrams for BSIT capstone projects.
Expertise: UML Diagrams · DFD · ER Diagrams · Use Case Diagrams · Activity Diagrams · Capstone Documentation · PHP · View all posts by Mary Grace G. Patulada →