
Student database management system ER diagram are used to show the relationship between table entities and the system’s logical database structure.
Specifically, an entity relationship diagram (ERD) shows the relationships between each table in the database.
To explain the ER diagram For Student Management System (database design), the diagram uses the following labels:
| Label | Meaning |
| Entity | It represents a table in a relational database, with each entity instance representing a row. The primary piece of code for an entity is its entity class, although entities can also utilize helper classes. |
| Attribute | An attribute in a database management system (DBMS) refers to a database component, such as a table. Additionally, it may refer to a database field and it specify the instances in a database’s columns. |
| Relationship | In the case of databases, a relationship exists between two relational database tables. This happens when the foreign key of one table references the primary key of the other table. Relationships enable relational databases to divide and store data in distinct tables while connecting diverse data objects. |
The database design (ERD) is also usable in Student Management System Data Flow Diagram.
Entity Relationship Diagram
An Entity Relationship Diagram (ERD, ER Diagram, or ER Model) is a form of database design or a specific structure diagram.
Moreover, this diagram uses different symbols and lines to show two important pieces of information. The important pieces are the main parts of the system and the relationships between them.
Example:
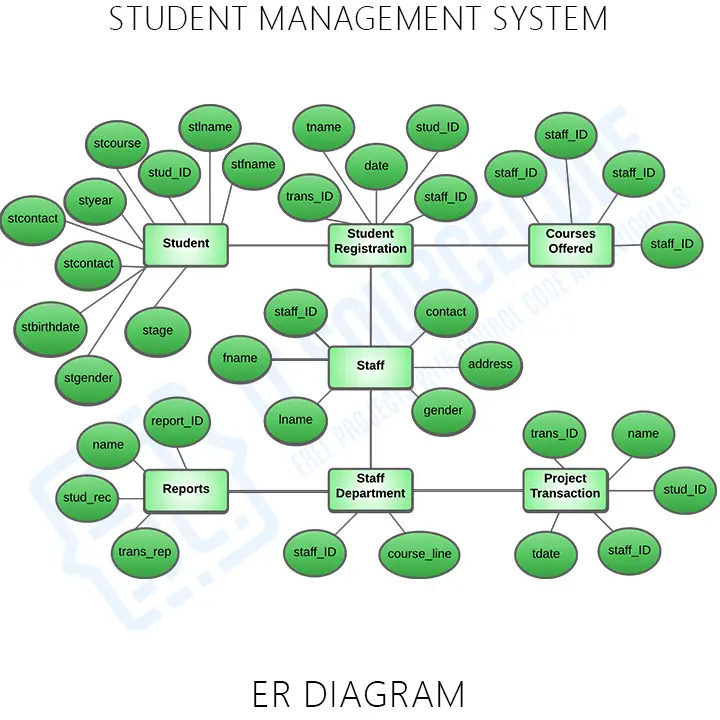
This ER diagram shows the overall entities in Student Management System. The entities are shown in form of rectangles, while their attributes are in form of circles or ovals.
In this ERD, the rectangle shape presents the entities. However, their attributes are shown in form of a circle shape attached to each entity.
Additionally, the example is the initial form of the system’s database design. Thus, the primary purpose of ERD is to let the users understand the structure of the admin’s interface.
| ENTITIES | ATTRIBUTES |
| Student: | stud_ID (PK), stfname, stlname, stcourse, styear, stcontact, stage, stbirthdate, and stgender |
| Courses Offered: | course_ID (PK), course_desc, units, course_remarks |
| Staff: | staff_ID (PK), fname, lname, contact, address, gender |
| Staff Department: | staff_ID (PK), course_line |
| Reports: | report_ID (PK), reports_name, student_records, transaction_reports |
| Student Registration: | registration_ID (PK), name, content, registration_date |
| Project Transactions: | transaction_ID (PK), transaction_name, stude_ID, staff_ID, transaction_date |
To create the ER diagram, you can simply collect the data that needs to be stored in the system. Then, generalize these data and create their attributes and they must be related to the kind of entity.
The given example cannot be applied directly to the system’s database. For this reason, a database design is required.
Student Management System Database Design
Modeling the data stored in a database requires the use of ER Diagrams. It is the basis upon which a database is built. Therefore, the ER diagram helps in explaining the types of data that will be stored in the student management system.
A database design (data model) is the structuring of data according to a database model. The designer defines which data items must be saved and their connections. Additionally, this allows them to begin fitting the data to the database model.
Example:

The Student Management System Database design is the storage of all the data that may enter and exit the system. It also orders the data according to ER Diagram model. Moreover, the developers will decide what data should be saved and how the various data parts should interact.
Additionally, it creates a guide of the project’s database logical and physical designs. Independent of physical factors, the logical model focuses on data needed and data to be stored.
Purpose of Student Management System Database Design:
- Organizes your data into subject-based tables to avoid repeating information.
- Gives access to the information necessary to join the tables as necessary.
- Assists in supporting and ensuring the accuracy and integrity of your data.
Tables in Database Design
The tables below provide the complete database design details such as Field Name, Descriptions, data types, and character lengths of the Student Management System.
Specifically, these roles are used to arrange every piece of data fed into the system. This makes sure that the data were managed well and secured.
Lastly, each of the Database tables was used to design the back end of the Student management system.
Table Name: tblStudent
| Field Name | Description | Type | Length |
| stud_ID (PK) | Student ID Number | Int | 11 |
| stfname | Student First Name | Varchar | 30 |
| stlname | Student Last Name | Varchar | 30 |
| stcourse | Student Course | Varchar | 30 |
| styear | Student Year | Int | 11 |
| stcontact | Student Contact Number | Int | 11 |
| stage | Student Age | Int | 11 |
| stbirthdate | Student Birth Date | Date | |
| stgender | Student Gender | Int | 11 |
Table Name: tblCourse
| Field Name | Description | Type | Length |
| course_ID (PK) | Course ID Number | Int | 11 |
| course_desc | Course Description | Text | |
| units | Course Units | Int | 11 |
| course_remarks | Course Remarks | Text |
Table Name: tblStaff
| Field Name | Description | Type | Length |
| staff_Id (PK) | Staff ID Number | Int | 11 |
| fname | Staff First Name | Varchar | 30 |
| lname | Staff Last Name | Varchar | 30 |
| contact | Staff Contact Number | Int | 11 |
| address | Staff Address | Varchar | 255 |
| gender | Staff Gender | Varchar | 30 |
Table Name: tblStaff_Department
| Field Name | Description | Type | Length |
| staff_ID (PK) | Staff ID Number | Int | 11 |
| course_line (FK) | Staff Course Line | Int | 11 |
Table Name: tblProject_Transaction
| Field Name | Description | Type | Length |
| transaction_ID (PK) | Transaction ID Number | Int | 11 |
| transaction_name | Transaction Name | Varchar | 30 |
| stud_ID (FK) | Student ID Number | Int | 11 |
| staff_ID (FK) | Staff ID Number | Int | 11 |
| transaction_date | Transaction Date | Date |
Table Name: tblStudent_Registration
| Field Name | Description | Type | Length |
| registration_ID | Registration ID Number | Int | 11 |
| name | Registration Name | Varchar | 30 |
| content | Registration Content | Varchar | 30 |
| registration_date | Registration Date | Date |
Table Name: tblStudent_Reports
| Field Name | Description | Type | Length |
| report_ID (PK) | Report ID Number | Int | 11 |
| reports_name | Report Name | Varchar | 30 |
| student_records (FK) | Student Record | Int | 11 |
| transaction_reports (FK) | Transaction Record | Int | 11 |
How to build ER Diagram for Student Management System?
Time needed: 5 minutes
Steps in building the ER Diagram for Student Management System.
- Step 1: Familiarize the ER Diagram (Entity Relationship Diagram)
The Entity Relationship Diagram shows the structure of data types in a project. It uses symbols to clarify its parts and relationships.
Moreover, their symbols and applications must be familiarized before you build the ER Diagram.
ER Diagram Symbols:
• Fields – Fields are the parts of a table that define the entity’s characteristics.
• Keys – a technique to categorize data qualities. It is used to organize ER diagrams and assist users in modeling their databases to ensure they are efficient.
– Primary Key: identifies a single entity instance which means a unique attribute or set of features.
– Foreign Key: is produced when data attributes have one-many relationships with other entities. - Step 2: Determine the targeted users
After the symbol familiarization, you’ll need to determine your targeted users. Your targeted users will be the ones to use your project.
- Step 3: Analyze the entities and their included attributes
Analyzation is very important in creating ER diagram. It will help you understand the work of the diagram and avoid unwanted errors.
The gathered information from the users is very useful in creating the diagram. You will evaluate the data and pick the useful ones. - Step 4: Plot the Entity Relationship Diagram
To plot the ERD you will need the entities, their attributes, and relationships. You will base the data structure from the evaluated information to have the exact Entity Relationship Diagram.
– To design the ER Diagram, you will list first all of the entities related to the Student Management System.
– Then you will place the attributes included under them. This will help you create the ER Diagram Fields.
– Do not forget the keys of the attributes. The keys will generate the potential relationships between entities.
– Finally, you have your ER Diagram Completed.
Reminder
The database design and entity relationship diagram are two different examples, intended for different users. These two conveys similar meaning but delivers idea differently.
Take note that the example diagrams represent the outline of the student management system project. However, it can be changed according to the needs of your users.
Nevertheless, the very purpose of the examples is to let the viewers understand how the system’s data store works. It points out the system’s entities (data store), its attributes, and the relationship between them.
Featured guides worth reading next
Official documentation
Working source code for this system
Download the actual implementation of this system in your preferred language. Each project includes source code, database, and setup instructions for BSIT capstone use.
- PHP: Student Information Management System in PHP
- VB.NET: Simple Student Enrollment System in MS Access Using VB.Net
- Java: Course Management System Project in Java With Source Code
- Python: Student Result Management System Project in Django
- Django: Student Management System in Django [Advance]
- Laravel: College Management System Project in Laravel with Source Code
Frequently Asked Questions
What is an ER Diagram for Student Management System?
An Entity-Relationship (ER) Diagram for Student Management System is a database design diagram that shows entities (Student, Teacher, Course, Subject, Grade), their attributes (name, ID, contact), and relationships (Student enrolls in Course, Teacher teaches Subject). It’s the foundation for creating the MySQL database schema.
What are the main entities in Student Management System ER Diagram?
The main entities in Student Management System ER Diagram are: Student (student_id, name, course, year, contact), Teacher (teacher_id, name, department, specialization), Subject (subject_id, name, units, prerequisites), Grade (grade_id, score, semester), Course (course_id, name, duration), and Attendance (date, status). Each has its own attributes and relationships.
What relationships exist in Student Management ER Diagram?
ER Diagram relationships in Student Management System include: Student ‘enrolls in’ Course (many-to-many), Teacher ‘teaches’ Subject (many-to-many), Student ‘receives’ Grade (one-to-many), Student ‘belongs to’ Section (many-to-one), Subject ‘belongs to’ Course (many-to-one), and Student ‘has’ Attendance records (one-to-many). Each relationship has cardinality (1, M, N).
How do you convert ER Diagram to database tables?
To convert Student Management ER Diagram to database tables: 1) Each entity becomes a table, 2) Attributes become columns with appropriate data types, 3) Primary keys are unique identifiers (student_id, teacher_id), 4) Many-to-one relationships add foreign keys, 5) Many-to-many relationships create junction tables (like student_subject), 6) Apply normalization (1NF, 2NF, 3NF) to eliminate redundancy.
What database is best for Student Management System?
MySQL is the most popular database for Student Management System capstone projects due to its free license, ease of use, and PHP integration. Other options include PostgreSQL (more advanced features), SQLite (for small/portable systems), or MariaDB (MySQL fork). For Philippine BSIT capstone, MySQL with phpMyAdmin is the standard recommendation.
Related Articles
- School Management System ER Diagram
- Student Enrollment System ER Diagram
- Student Management System Project Report
- University Management System ER Diagram
- ER Diagram for Attendance Management System
- Student Management System UML Diagrams
- ER Diagram for Online Ordering System
Conclusion
In conclusion, the student ER Diagram (Database Design) is shown by entities and attributes. The entities are database tables and the table columns are the attributes.

Mary Grace G. Patulada
Programmer & Technical Writer at PIES IT Solution
Mary Grace G. Patulada (pen name ‘Nym’) is a programmer and writer at PIES IT Solution with a BSIT background from Carlos Hilado Memorial State College, Binalbagan Campus. Authored 370+ UML diagram tutorials and capstone documentation guides at itsourcecode.com. Specializes in UML (class, use case, activity, sequence, component, deployment), DFD, and ER diagrams for BSIT capstone projects.
Expertise: UML Diagrams · DFD · ER Diagrams · Use Case Diagrams · Activity Diagrams · Capstone Documentation · PHP · View all posts by Mary Grace G. Patulada →
this project it’s okey but
add student not avalable why?
There is no source code in er diagram