
The university management system ER diagram shows the relationships of the system’s entities that build its database design. This describes the logical structure of the system’s database or data storage. It is done by identifying the university management process entities, their properties, and the interactions between them.
The university management system database design is sketched out using ER (entity-relationship) diagram. This sketch becomes the actual basis of the system’s data storage that will serve as data destination and source.
ER Diagram University Management System: Details
The table shows the overall description of the ER Diagram for University Management System. It has a complete overview of the project’s information.
| Name: | University Management System ER Diagram |
| Abstract: | The university management system ER diagram depicts the relationship between various entities. It can be thought of as a blueprint for your system (project) structure. |
| Diagram: | ER Diagram is also known as Entity Relationship Diagram |
| Tools Used: | Diagraming tools that provide ER diagram symbols. |
| Users: | University’s Admin and Staff and the students. |
| Designer: | ITSourceCode.com |
What is University Management System?
The university management system automates tasks (UMS). Helping students access online and classroom learning, enrolling, admitting, onboarding, handling fees, and managing lecturer payroll.
University Management System Features
- University Management: This system’s main feature, the ER diagram, contains university details. Courses and programs were listed.
- Student Management: This feature gathers important student information. This information was used to track transactions and system issues.
- Manage Courses and Subjects: The university admin has to decide which classes each student will take and who will teach each class.
- Manage Instructors: This system manages instructors’ information and class schedules.
- Transaction and Scheduling Management: It stores student and instructor transactions, schedules, and timetables.
What is an ER Diagram?
The ER Diagram is DBMS’s university management system database design. It depicts all system entities’ relationships graphically. Entities, attributes, and relationships are the major components.
Importance of ER Diagram
ER diagrams help model a university’s database and data storage. It’s the project’s database foundation. Entity-relationship diagrams (ERDs) in university management systems help define data types, attributes, and characteristics.
ER Diagram for University Management System
ER Diagram of University Management System shows the system entity relationships in each entity and their supposed functions in each relationship.
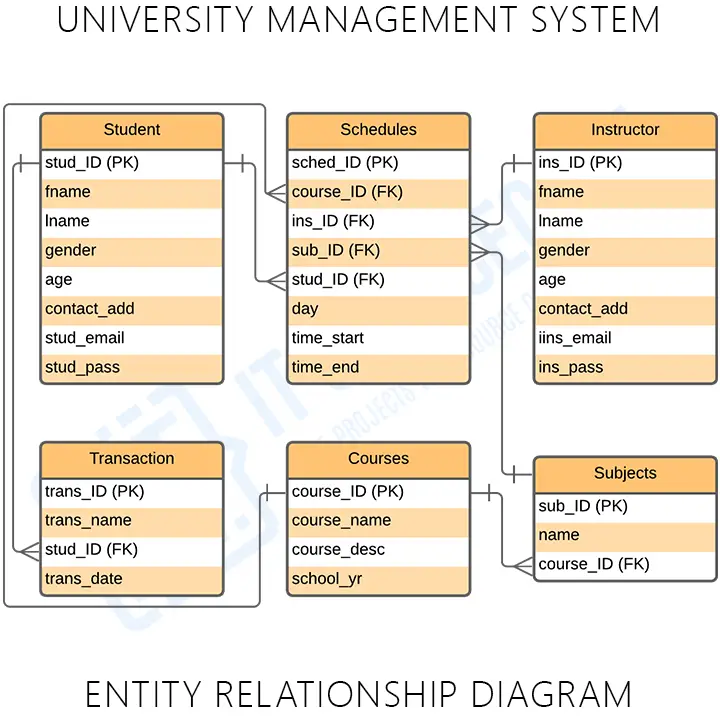
Students, schedules, instructors, transactions, courses, and subjects make up the Entity Relationship diagram for university management system tables.
The tables satisfy the system’s requirements and provide detailed information about each entity.
University Management System Database Design
This database was designed for university management needs. Students’ information can be encoded in the system.
Administrators at the university can see how students are doing and what important things they are doing, like managing files and enrollee activities.
University Management System ER Diagram Tables
These tables below provide the complete database table details such as Field Name, Descriptions, data types, and character lengths.
Table Name: Student
| Field | Description | Type | Length |
| stud_ID (PK) | Student ID | Int | 11 |
| fname | Student First Name | Varchar | 255 |
| lname | Student Last Name | Varchar | 255 |
| gender | Student Gender | Int | 11 |
| age | Student Age | Int | 11 |
| contact_add | Contact Address | Int | 11 |
| stud_email | Student Email | Varchar | 255 |
| stud_pass | Student Password | Varchar | 255 |
Table Name: Instructor
| Field | Description | Type | Length |
| ins_ID (PK) | Instructor ID | Int | 11 |
| fname | Instructor First Name | Varchar | 255 |
| lname | Instructor Last Name | Varchar | 255 |
| gender | Instructor Gender | Int | 11 |
| age | Instructor Age | Int | 11 |
| contact_add | Contact Address | Int | 11 |
| ins_email | Instructor Email | Varchar | 255 |
| ins_pass | Instructor Password | Varchar | 255 |
Table Name: Course
| Field | Description | Type | Length |
| course_ID (PK) | Course ID | Int | 11 |
| course_name | Course Name | Varchar | 30 |
| course_desc | Course Description | Varchar | 30 |
| school_yr | School Year | Int | 11 |
Table Name: Subjects
| Field | Description | Type | Length |
| sub_ID (PK) | Subject ID | Int | 11 |
| name | Subject Name | Varchar | 255 |
| course_ID (FK) | Course ID | Int | 11 |
Table Name: Schedules
| Field | Description | Type | Length |
| sched_ID (PK) | Schedule ID | Int | 11 |
| course_ID (FK) | Course ID | Int | 11 |
| sub_ID (FK) | Subject ID | Int | 11 |
| ins_ID (FK) | Instructor ID | Int | 11 |
| stud_ID (FK) | Student ID | Int | 11 |
| day | Day of schedule | Date | |
| time_start | Starting Time | Time | |
| time_end | Time Ended | Time |
Table Name: Transactions
| Field | Description | Type | Length |
| trans_ID (PK) | Transaction ID | Int | 11 |
| trans_name | Transaction Name | Int | 11 |
| stud_ID (FK) | Student ID | Int | 11 |
| trans_date | Transaction Date | Date |
The tables will help developers design the university management system database. It contains the complete database description and will be entered into the program or data storage along with the table names. They’ll create a database with attributes and values.
University Management System ER Diagram [PDF]
The DBMS Entity Relationship Diagram for University Management System explains the project database. This can be used for your capstone. You can use it directly or modify it for your project.
How to create an Entity-Relationship (ER) Diagram
Time needed: 5 minutes
Steps in building the ER Diagram for University Management System with Cardinality Ratio.
- Step 1: Familiarize the ER Diagram (Entity Relationship Diagram) Symbols and Cardinality
The Entity Relationship Diagram shows project data types. Symbols show its parts and relationships. Before creating an ER Diagram, learn its symbols and applications.
ER Diagram Symbols:
• Field – In a table, we define an entity’s characteristics. In the ERD-modeled database, attributes are rows.
• Keys – The data categorization technique It helps users model efficient databases and organize ER diagrams. connects database tables.
– Primary Key: identifies a single entity instance which means a unique attribute or set of attributes.
– Foreign Key: is produced when data attributes have one too many relationships with other entities. - Step 2: Finalize the entities included
Finalize the university management system entities before designing your ER Diagram. This entity is a rectangle, so leave plenty of room for it in upcoming updates.
- Step 3: Add the attributes of each entity
After finalizing the entities, consider their qualities. As attributes, ER diagram entities are described. Attributes include entity characteristics, many-to-many and one-to-one relationships. Multivalued attributes have multiple values.
- Step 4: Describe the relationships (cardinality) between entities and attributes
Entities, attributes, and relationships are needed to plot ERD relationships. You’ll build the entity relationship diagram from the evaluated data.
Conclusion:
An ER (entity-relationship) diagram is used to design and develop UMS. Your diagrams will help you present your ideas and skills.
ER diagrams help you visualize the software’s back end, which holds all incoming and outgoing data. Read the suggested articles below to learn more about ER Diagrams.
Related Articles:
- Barangay Information System ER Diagram
- ER Diagram for Online Ordering System
- ER Diagram for Bank Management System
- ER Diagram for Hotel Management System
- ER Diagram for Student Management System
Inquiries
Leave questions or comments about the University Management System Entity Relationship Diagram below. We’d love to hear your concerns and suggestions and help you learn.
Keep us updated and Good day!
Official documentation
Working source code for this system
Download the actual implementation of this system in your preferred language. Each project includes source code, database, and setup instructions for BSIT capstone use.
- PHP: Car Driving School Management System in PHP with Source Code
- VB.NET: School Management System Version 3.0 in VB.net with Source Code
- Java: University Management System Project in Java With Source Code
- Python: College Management System Using Django with Source Code
- Django: College Management System Using Django with Source Code
- Laravel: School Management System in Laravel With Source Code
Frequently asked questions
What is a ER diagram used for in BSIT capstone?
An ER diagram shows the database schema: entities (tables), attributes (columns), and relationships (foreign keys, cardinality). It goes in Chapter 3 alongside the class diagram to communicate the data storage design.
What tool should I use to draw the ER diagram?
Free options: draw.io (browser-based, saves to Google Drive), Lucidchart free tier, PlantUML (text-based, version-controllable), StarUML (30-day trial then reduced feature set), Visual Paradigm Community Edition. Paid options: Microsoft Visio, Lucidchart pro, Enterprise Architect. For BSIT capstones, draw.io is the most commonly used free tool.
How detailed does the ER diagram need to be for capstone defense?
Panel members expect the diagram to match the actual system implementation. Include every major class/use case/entity relevant to the system. Omit trivial helper classes. Every diagram element should have a clear justification. Aim for 1-2 diagrams that fully cover the system, not many partial ones.
Should I use black-and-white or colored diagrams?
Black-and-white is standard for capstone documentation to match the thesis format. Use color only if it improves clarity (e.g., grouping subsystems). Ensure text is readable at printed size (10pt minimum for labels).
Where does this diagram go in the capstone documentation?
Chapter 3 (System Design and Methodology) typically holds all UML diagrams. Introduce each diagram with a 1-paragraph description explaining what it shows and how to read it. Reference specific elements in the surrounding text so panel members can follow the design rationale.

Mary Grace G. Patulada
Programmer & Technical Writer at PIES IT Solution
Mary Grace G. Patulada (pen name ‘Nym’) is a programmer and writer at PIES IT Solution with a BSIT background from Carlos Hilado Memorial State College, Binalbagan Campus. Authored 370+ UML diagram tutorials and capstone documentation guides at itsourcecode.com. Specializes in UML (class, use case, activity, sequence, component, deployment), DFD, and ER diagrams for BSIT capstone projects.
Expertise: UML Diagrams · DFD · ER Diagrams · Use Case Diagrams · Activity Diagrams · Capstone Documentation · PHP · View all posts by Mary Grace G. Patulada →
I love You
will you marry your Husband???