
ER diagram for hotel management system in DBMS illustrates how database elements are related. This shows how the system’s database or data storage is put together logically. It is done by figuring out the parts of the hotel management process, their properties, and how they work together.
Draw an Entity Relationship diagram for hotel management system are used to draw out the design of the database. This database sketch becomes the system’s data storage, where data goes and comes from.
Hotel Management System ER Diagram: Details
The table shows the overall description of the Entity Relationship Diagram Hotel Management System in DBMS. It has a complete overview of the project’s information.
| Name: | Hotel Management System ER Diagram |
| Abstract: | The hotel management system ER diagram depicts the relationship between various entities. It can be thought of as a blueprint for your system (project) structure. |
| Diagram: | ER Diagram is also known as Entity Relationship Diagram |
| Tools Used: | Diagraming tools that provide ER diagram symbols. |
| Users: | Website, Applications, and Software. |
| Designer: | ITSourceCode.com |
What is Hotel Management System?
The hotel management software is a set of hotel management apps that keep things running smoothly. Accounting software, customer relationship management software, and a huge number of industry-specific programs are all available.
What is an ER Diagram?
The ER Diagram is also known as the database design for the hotel management system project. This ER diagram is a picture of how all the entities in the system are related to each other. Entities, Attributes, and Relationships are its most important parts.
Importance of ER Diagram
Simple Entity Relationship diagram for hotel management system data storage or database. It is the foundation for building the project’s database foundation. This entity-relationship diagram (ERD) defines data types, attributes, and properties.
Entity-Relationship (ER) Diagram for Hotel Management System
The Hotel Management System’s ER Diagram shows system entities (data) and their roles (attributes). Each of them was represented by a table that showed what they were like and how they related to each other.
ER Diagram Hotel Management System Project (Database Design)
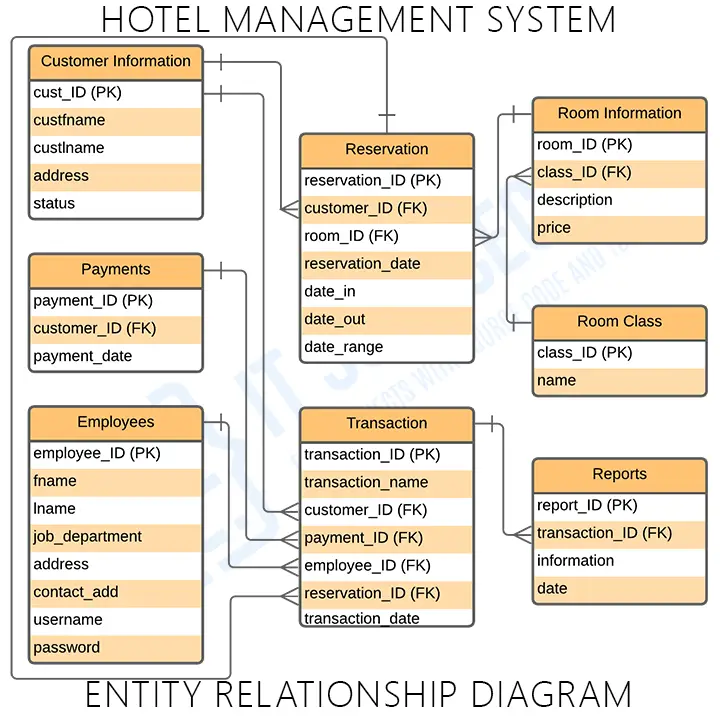
The example shows the Hotel Management System ER Diagram database design. This shows that all system data and user outputs are saved in a database. A Hotel Management System in DBMS needs a good database or ER Diagram design.
Hotel Management System ER Diagram Tables
The tables below list each database table’s field name, description, data type, and character length. Each table defines and explains data storage.
The field column lists database attributes, whereas the description column describes each. Type shows what kind of data each attribute is, and length displays how many characters it has.
Table Name: tblCustomer
| Field | Description | Type | Length |
| cust_ID (PK) | Customer ID | Int | 11 |
| custfname | Customer First Name | Varchar | 255 |
| custlname | Customer Last Name | Varchar | 255 |
| reservation | Customer Reservation | Varchar | 255 |
| address | Customer Address | Varchar | 255 |
| status | Customer Status | Varchar | 255 |
| contact_address | Contact Address | Int | 11 |
Table Name: tblRoom
| Field | Description | Type | Length |
| room_ID (PK) | Room ID | Int | 11 |
| room_type | Room Type | Varchar | 30 |
| room_sample | Room Sample | Varchar | 30 |
| description | Room Description | Text |
Table Name: tblReservation
| Field | Description | Type | Length |
| reservation_ID (PK) | Reservation ID | Int | 11 |
| customer_ID (FK) | Customer ID | Int | 11 |
| room_ID (FK) | Room ID | Int | 11 |
| reservation_date | Date of Reservation | Date | |
| date_in | Date of Coming In | Date | |
| date_out | Date of Coming Out | Date | |
| days_range | Range of Days | Int | 11 |
Table Name: tblRoomClass
| Field | Description | Type | Length |
| class_ID (PK) | Room Class ID | Int | 11 |
| name | Room Name | Varchar | 30 |
| price | Room Price | Int | 11 |
Table Name: tblPayment
| Field | Description | Type | Length |
| payment_ID (PK) | Payment ID | Int | 11 |
| customer_ID (FK) | Customer Id | Int | 11 |
| type | Payment Type | Varchar | 30 |
| payment_date | Date of Payment | Date |
Table Name: tblEmployees
| Field | Description | Type | Length |
| employee_ID (PK) | Employee Id | Int | 11 |
| fname | First Name | Varchar | 30 |
| lname | Last Name | Varchar | 30 |
| job_department | Job Department | Varchar | 30 |
| address | Address | Text | |
| contact_address | Contact Address | Int | 11 |
| username | Username | Varchar | 30 |
| password | Password | Varchar | 30 |
Table Name: tblTransactions
| Field | Description | Type | Length |
| transaction_ID (PK) | Transaction ID | Int | 11 |
| transaction_name | Transaction Name | Varchar | 30 |
| customer_ID (FK) | Customer ID | Int | 11 |
| employee_ID (FK) | Employee ID | Int | 11 |
| reservation_ID (FK) | Reservation ID | Int | 11 |
| transaction_date | Transaction Date | Date |
Table Name: tblReports
| Field | Description | Type | Length |
| report_ID (PK) | Report ID | Int | 11 |
| transaction_ID (FK) | Transaction ID | Int | 11 |
| name | Report name | Varchar | 30 |
| type | Report Type | Varchar | 30 |
The tables will help developers set up the hotel management system’s database. It offers a full description of the database along with table names. They’ll enter attributes and values into a database.
Hotel Management System ERD [PDF]
The information about how the project database works is in the ER Diagram for Hotel Management System PDF. This information can help you with your capstone project. You can also use it as is or change its content to fit the needs of your project.
How to create ER Diagram
Time needed: 5 minutes
Steps in building the ER Diagram for Hotel Management System with Cardinality Ratio.
- Step 1: Familiarize the ER Diagram (Entity Relationship Diagram) Symbols and Cardinality
The project’s data structure is shown in the Entity Relationship Diagram. Symbols show how its parts fit together. Before making an ER Diagram, you should know what its symbols mean and how to use them.
ER Diagram Symbols:
• Fields: The Entity Relationship Diagram shows how the different types of data in a project are put together. It uses symbols to show how its parts work together. Before making the ER Diagram, you need to know what their symbols mean and how to use them.
Keys is a technique to categorize data quality.
– Primary keys are unique attributes or sets of properties used to find a particular entity.
– A “Foreign Key” is made when a piece of data has too many links to other things. - Step 2: Finalize the entities included
Start making your ER Diagram by deciding on all the parts your blood bank management system must have. You’ll need to leave area in your design for these rectangles to be included later.
- Step 3: Add the attributes of each entity
After you’ve decided on the entities, think about the traits you’ll need for each one. In a conceptual ER diagram, the details of the different entities are given as attributes. Attributes are things like a thing’s traits, a many-to-many relationship, or a one-to-one relationship. Attributes with multiple values can be given more than one value.
- Step 4: Describe the relationships (cardinality) between entities and attributes
You will need the entities, their attributes, and the relationships between them in order to plot the relationships between the ERD. To get the right entity relationship diagram, you will use the information you gathered to build the data structure.
Conclusion
You need to know how the Hotel Management System was designed and built using diagrams. With the help of an ER diagram, that will help you make a system that works well.
Making it will help you understand how the software works behind the scenes. This is where all the data that goes in and out of the system will be stored.
Related Articles
- ER Diagram for Online Hotel Reservation System
- DFD for Hotel Management System
- Resort Management System Database Design with ERD
- Activity Diagram for Hotel Management System
- ER Diagram for Online Ordering System
- Component Diagram for Hotel Management System
- Hotel Management System Project Report
Inquiries
Leave us a comment below if you have questions or ideas about the ER Diagram for Hotel Management System. We would love to hear about your worries and ideas and help you learn.
Official documentation
Working source code for this system
Download the actual implementation of this system in your preferred language. Each project includes source code, database, and setup instructions for BSIT capstone use.
- PHP: Online Hotel Management System Project In PHP
- VB.NET: Monbela Hotel Management System Project Using VB.Net and MS Access Version 2.0.0
- Java: Hotel Management System Project in Java With Source Code
- Python: Django Hotel Management System With Source Code
- Django: Django Hotel Management System With Source Code
- Laravel: Hotel Management System Project in Laravel With Source Code
Frequently asked questions
What is a ER diagram used for in BSIT capstone?
An ER diagram shows the database schema: entities (tables), attributes (columns), and relationships (foreign keys, cardinality). It goes in Chapter 3 alongside the class diagram to communicate the data storage design.
What tool should I use to draw the ER diagram?
Free options: draw.io (browser-based, saves to Google Drive), Lucidchart free tier, PlantUML (text-based, version-controllable), StarUML (30-day trial then reduced feature set), Visual Paradigm Community Edition. Paid options: Microsoft Visio, Lucidchart pro, Enterprise Architect. For BSIT capstones, draw.io is the most commonly used free tool.
How detailed does the ER diagram need to be for capstone defense?
Panel members expect the diagram to match the actual system implementation. Include every major class/use case/entity relevant to the system. Omit trivial helper classes. Every diagram element should have a clear justification. Aim for 1-2 diagrams that fully cover the system, not many partial ones.
Should I use black-and-white or colored diagrams?
Black-and-white is standard for capstone documentation to match the thesis format. Use color only if it improves clarity (e.g., grouping subsystems). Ensure text is readable at printed size (10pt minimum for labels).
Where does this diagram go in the capstone documentation?
Chapter 3 (System Design and Methodology) typically holds all UML diagrams. Introduce each diagram with a 1-paragraph description explaining what it shows and how to read it. Reference specific elements in the surrounding text so panel members can follow the design rationale.

Mary Grace G. Patulada
Programmer & Technical Writer at PIES IT Solution
Mary Grace G. Patulada (pen name ‘Nym’) is a programmer and writer at PIES IT Solution with a BSIT background from Carlos Hilado Memorial State College, Binalbagan Campus. Authored 370+ UML diagram tutorials and capstone documentation guides at itsourcecode.com. Specializes in UML (class, use case, activity, sequence, component, deployment), DFD, and ER diagrams for BSIT capstone projects.
Expertise: UML Diagrams · DFD · ER Diagrams · Use Case Diagrams · Activity Diagrams · Capstone Documentation · PHP · View all posts by Mary Grace G. Patulada →