
The ER diagram for the bank management system in DBMS reveals the relationships of the bank management entities within its database.
This describes the logical structure of the system’s database or data storage. To do this, determine the online banking process entities, their properties, and how they interact.
The database design is sketched out using bank management system ER diagrams. This database sketch becomes the system’s data destination and source.
Bank Management System ER Diagram: Details
The table shows the overall description of the ER Diagram for the Bank Management System. It has a complete overview of the project’s information.
| Name: | Bank Management System ER Diagram |
| Abstract: | The bank management system ER diagram depicts the relationship between various entities. It can be thought of as a blueprint for your system (project) structure. |
| Diagram: | ER Diagram is also known as Entity Relationship Diagram |
| Tools Used: | Diagraming tools that provide ER diagram symbols. |
| Users: | Bank Members, Admin, and Employees. |
| Designer: | ITSourceCode.com |
What is Bank Management System?
A bank management system is a way for financial transactions to be done online. In banking systems, people do things by hand. When we use online banking, we use a technique called “virtual machines,” which automates tasks that used to be done by hand.
Bank Management System Database Design
This bank management system er diagram in DBMS was made based on bank requirements. The system can encode customer information. The banking admin can have access to the customer status and information for important transactions. They manage customer and employee files and transactions.
What is an ER Diagram?
In DBMS, the ER Diagram is referred to as the bank management system database design. This ER Diagram is the graphical depiction of relationships between all the entities involved in the system. Its major components are entities, attributes, and relationships.
Importance of ER Diagram
The importance of the ER diagram for a bank’s management system is to help in modeling its data storage or database. It is the basis of the project’s database foundation for construction. This entity relationship diagram (ERD) also aids in defining the data types to be stored, such as their attributes and characteristics.
ER Diagram for Bank Management System
The Bank Management System’s ER Diagram shows entity relationships and their functions.
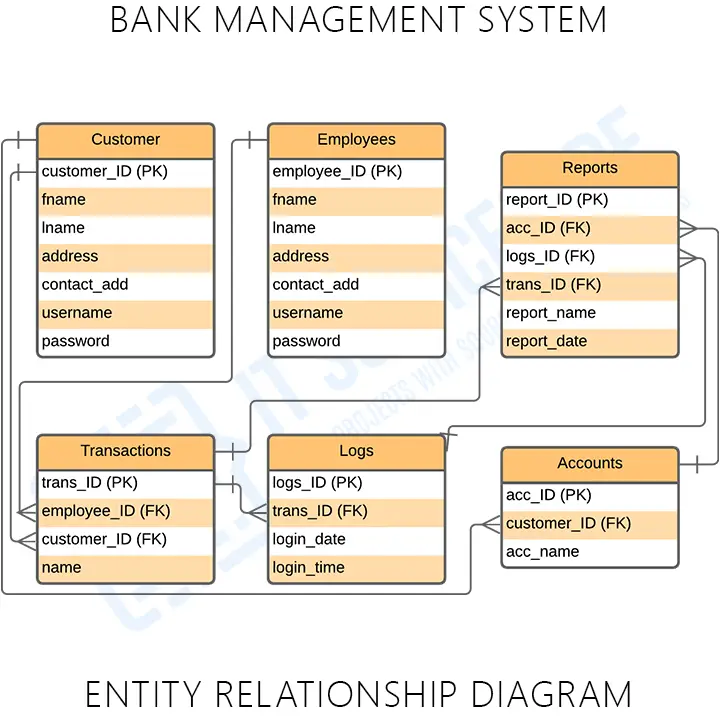
Based on the image above, the ER diagram for this system is the entity of the bank management system database. Which are presented by tables: customer, employee, reports, transactions, logs, and accounts. These tables meet the system’s requirements and provide more details about each entity.
Bank Management System ER Diagram Tables
These tables below provide the complete database table details such as field names, descriptions, data types, and character lengths. Each of these tables represents the characteristics and attributes of data storage.
Field lists each database’s attributes, description explains each, type lists their data type, and length lists their character lengths.
Table Name: Customer
| Field | Description | Type | Length |
| customer_ID (PK) | Customer ID | Int | 11 |
| fname | Customer First Name | Varchar | 255 |
| lname | Customer Last Name | Varchar | 255 |
| contact_add | Customer Contact | Int | 11 |
| address | Customer Address | Text | |
| Customer Email | Varchar | 255 | |
| password | Customer Password | Varchar | 255 |
Table Name: Admin
| Field | Description | Type | Length |
| admin_ID (PK) | Admin ID | Int | 11 |
| fname | Admin First Name | Varchar | 255 |
| lname | Admin Last Name | Varchar | 255 |
| address | Admin Address | Text | |
| Admin Email | Varchar | 255 | |
| password | Admin Password | Varchar | 255 |
Table Name: Employee
| Field | Description | Type | Length |
| employee_ID (PK) | Employee Id | Int | 11 |
| fname | First Name | Varchar | 30 |
| lname | Last Name | Varchar | 30 |
| address | Address | Text | |
| contact_address | Contact Address | Int | 11 |
| Varchar | 30 | ||
| password | Password | Varchar | 30 |
Table Name: Bank Account
| Field | Description | Type | Length |
| acc_ID (PK) | Account ID | Int | 11 |
| customer_ID (FK) | Customer ID | Int | 11 |
| acc_name | Account Name | Varchar | 255 |
Table Name: Logs
| Field | Description | Type | Length |
| logs_ID (PK) | Login ID | Int | 11 |
| trans_ID (FK) | Transaction ID | Int | 11 |
| login_date | Login Date | Date | 30 |
| login_time | Login time | Time |
Table Name: Transactions
| Field | Description | Type | Length |
| transaction_ID (PK) | Transaction ID | Int | 11 |
| employee_ID (FK) | Transaction Name | Int | 11 |
| customer_ID (FK) | Customer ID | Int | 11 |
| transaction_name | Employee ID | Varchar | 255 |
| transaction_date | Transaction Date | Date |
Table Name: Reports
| Field | Description | Type | Length |
| report_ID (PK) | Report ID | Int | 11 |
| acc_ID (FK) | Account ID | Int | 11 |
| logs_ID (FK) | Logs ID | Int | 11 |
| trans_ID | Transaction ID | Int | 11 |
| report_name | Report name | Varchar | 255 |
| report_date | Report Type | Varchar | 255 |
The tables given will be the basis for developers on how they will do the bank management system database design. It contains the complete database description and will be entered into the program or data storage as the table names. They will create a database with the attributes given as well as the value of each attribute.
Bank Management System ER Diagram [PDF]
The ER Diagram for Bank Management System in DBMS PDF provides information explaining the concepts of the project database. You may apply this information to your capstone project. You can also use it as is or change its content to fit the needs of your project.
How to create ER Diagram
Time needed: 5 minutes
Steps in building the ER Diagram for Bank Management System with Cardinality Ratio.
- Step 1: Familiarize the ER Diagram (Entity Relationship Diagram) Symbols and Cardinality
The Entity Relationship Diagram shows the structure of data types in a project. It uses symbols to clarify its parts and relationships. Their symbols and applications must be familiar before you build the ER Diagram.
ER Diagram Symbols:
• Fields: Fields are the parts of a table that define the entity’s characteristics. In the database that the ERD models, attributes are commonly thought of as rows.
• Keys is a technique to categorize data quality. It is used to organize ER diagrams and assist users in modeling their databases to ensure that they are efficient. This is also used to connect different tables in a database.
– A primary key identifies a single entity instance, which means a unique attribute or set of attributes.
– A foreign key is produced when data attributes have one too many relationships with other entities. - Step 2: Finalize the entities included
Start designing your ER Diagram by finalizing the entities that must be included in your bank’s management system. You should leave plenty of room for this rectangle in future phases so you can add it to your design.
- Step 3: Add the attributes of each entity
After finalizing the entities, think about the qualities you’ll need to characterize each entity. The details of the various entities outlined in a conceptual ER diagram are supplied as attributes. All of these are examples of attributes. Multivalued attributes can be assigned to several values.
- Step 4: Describe the relationships (cardinality) between entities and attributes
To plot relationships between the ERD you will need the entities, their attributes, and relationships. You will base the data structure from the evaluated information to have the exact Entity Relationship Diagram.
Conclusion:
You need to know the diagrams used to design and develop the bank management system. That is to help you create a fully functional system with the use of the ER Diagram. Creating it will help you perceive the back end of the software. This will hold all the data that’ll enter and exit the system.
Related Articles:
- ER Diagram for ATM System | Entity Relationship Diagram
- Blood Bank Management System ER (Entity Relationship) Diagram
- Bank Management System UML Diagrams
- ER Diagram for Order Management System
- Loan Management System ER Diagram
- Bank Management System Class Diagram
Inquiries
If you have inquiries or suggestions about the ER Diagram for Bank Management System, just leave us your comments below. We would be glad to know your concerns and suggestions and be part of your learning.
Keep us updated and Good day!
Official documentation
Working source code for this system
Download the actual implementation of this system in your preferred language. Each project includes source code, database, and setup instructions for BSIT capstone use.
- PHP: Online Blood Bank Management System in PHP with Source Code
- Java: Bank Management System Project In Java NetBeans Source Code
- Python: Bank Management System Project in Django with Source Code
- Django: Bank Management System Project in Django with Source Code
- Laravel: Online Banking Management System Project in Laravel with Source Code
Frequently asked questions
What is a ER diagram used for in BSIT capstone?
An ER diagram shows the database schema: entities (tables), attributes (columns), and relationships (foreign keys, cardinality). It goes in Chapter 3 alongside the class diagram to communicate the data storage design.
What tool should I use to draw the ER diagram?
Free options: draw.io (browser-based, saves to Google Drive), Lucidchart free tier, PlantUML (text-based, version-controllable), StarUML (30-day trial then reduced feature set), Visual Paradigm Community Edition. Paid options: Microsoft Visio, Lucidchart pro, Enterprise Architect. For BSIT capstones, draw.io is the most commonly used free tool.
How detailed does the ER diagram need to be for capstone defense?
Panel members expect the diagram to match the actual system implementation. Include every major class/use case/entity relevant to the system. Omit trivial helper classes. Every diagram element should have a clear justification. Aim for 1-2 diagrams that fully cover the system, not many partial ones.
Should I use black-and-white or colored diagrams?
Black-and-white is standard for capstone documentation to match the thesis format. Use color only if it improves clarity (e.g., grouping subsystems). Ensure text is readable at printed size (10pt minimum for labels).
Where does this diagram go in the capstone documentation?
Chapter 3 (System Design and Methodology) typically holds all UML diagrams. Introduce each diagram with a 1-paragraph description explaining what it shows and how to read it. Reference specific elements in the surrounding text so panel members can follow the design rationale.

Mary Grace G. Patulada
Programmer & Technical Writer at PIES IT Solution
Mary Grace G. Patulada (pen name ‘Nym’) is a programmer and writer at PIES IT Solution with a BSIT background from Carlos Hilado Memorial State College, Binalbagan Campus. Authored 370+ UML diagram tutorials and capstone documentation guides at itsourcecode.com. Specializes in UML (class, use case, activity, sequence, component, deployment), DFD, and ER diagrams for BSIT capstone projects.
Expertise: UML Diagrams · DFD · ER Diagrams · Use Case Diagrams · Activity Diagrams · Capstone Documentation · PHP · View all posts by Mary Grace G. Patulada →