
Deployment Diagram for College Management System
The deployment diagram for college management system shows the physical architecture applied for the system to work. This deployment diagram is one of the UML diagrams used to describe the physical structure of college management.
College Management System Deployment Diagram: Table of contents
- Deployment Diagram for College Management System
- Deployment Diagram for College Management System: Content
- College Management System Deployment Diagram Description
- UML Deployment Diagram for College Management System
- Deployment Diagram for College Management System
- College Management System UML Deployment Diagram (Explanation)
- Deployment Diagram for College Management System (PDF)
- Advantages of College System Deployment Diagram
- Steps in Developing College Management System Deployment Diagram
- Additional Knowledge
- Conclusion
- Related Articles:
- Recommended Articles from the Author:
- Inquiries
Deployment Diagram for College Management System: Content
The table shows the basic details of the deployment diagram of the college system. It has quick description details of the project.
| Name: | College Management System Deployment Diagram |
| Abstract: | The College Management System Deployment Diagram represents the physical structure of the project. It reveals the software and hardware included for the application to work correctly. |
| UML Diagram: | Deployment Diagram |
| Users: | Tertiary Education Admin, Staff, and Students. |
| Tools Used: | Diagraming Tools that have UML Deployment Diagram Symbols |
| Designer: | ITSourceCode.com |
College Management System Deployment Diagram Description
The college management system deployment diagram assists in describing the system’s processes such as data storage, student profile maintenance, administrative and academic data analysis, improved communication, and student engagement. These processes will pass through the nodes until the user who requested it receives the outcome.
The whole process includes links that serve as the source and storage of the data (information). These links are the software and hardware used as channels of data to carry out the process. Then links are associated with connections to properly describe the paths and destinations of users’ requests.
The deployment diagram clarifies the movement of processes within nodes (hardware and software) in reality. The movement is mapped out to come up with the system’s architectural structure.
UML Deployment Diagram for College Management System
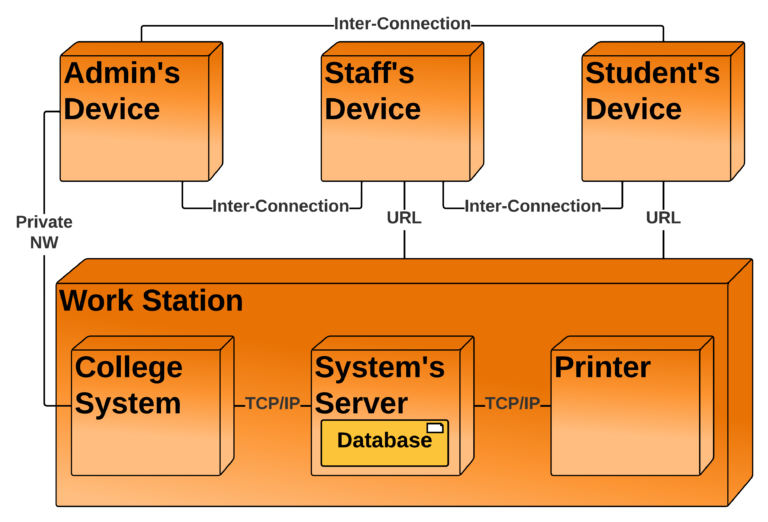
UML deployment diagram for the college management system is used to illustrate its’ physical architecture. In UML, deployment diagrams can show you how the software and hardware of the learning system work together and where the processing takes place.
The college system uses a UML deployment diagram to show how should the developed software be deployed. It clarifies the communications between links(nodes) which helps the project to work according to the design given to it. Deployment diagrams depict the setup of run-time processing nodes and the components that reside on them.
Deployment Diagram for College Management System
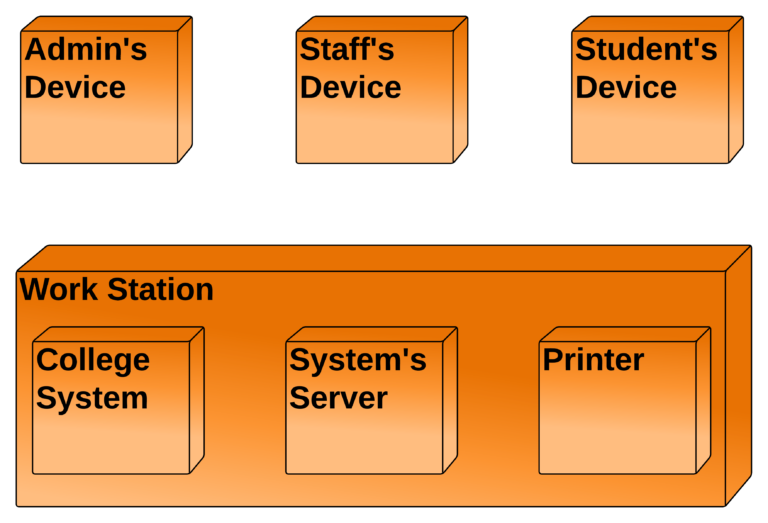
The nodes included in the system’s deployment diagram are represented by boxes. These boxes are labeled as software or hardware that specifies the included components to carry out the college management process. The boxes will then be connected and labeled to declare the type of connection they have with the other components.
The College Management System is an end-to-end system for schools that automates the student-faculty lifecycle and campus administration to increase operational efficiency and outcomes. With numerous links included, this deployment diagram helps institutions speed up all of their most important tasks.
College Management System UML Deployment Diagram (Explanation)
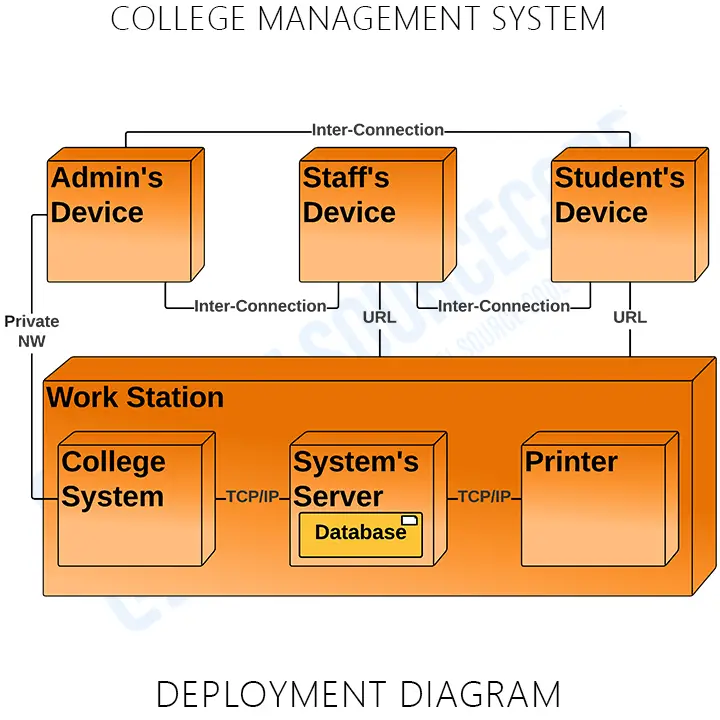
The College Management System UML deployment diagram explains the sketch of the relationship between software and hardware. These hardware and software are labeled to clarify their part in the system’s operation. They were represented by nodes and their connections were represented by labeled lines.
The deployment diagram shows the scenario when the system is deployed. It has 7 nodes represented with boxes and relationship connections. The nodes are the college management system, the admin’s device, the staff’s device, the student’s device, the printer, and the database (system server). The system server node contains a developed database that will hold the details of the system through a private connection or online.
For the connection, the system is connected to the server database using TCP/IP which enables it to pass a connection to the devices and enable users to access the system and database. The admin and the customer then can communicate using an online or internet connection.
Deployment Diagram for College Management System (PDF)
You may download the Deployment Diagram PDF by clicking the button below. It has the full details and discussion on System’s Deployment Diagram. You can also modify its content to complete your project requirements and needs.
Advantages of College System Deployment Diagram
- Portrays the deployment view of the college management system.
- Helps in visualizing the topological view of the college management system.
- Models the physical architecture of the college management system.
- Shows the relationships between the software and hardware components in the college management system.
- Shows the physical distribution of the system’s processing.
Steps in Developing College Management System Deployment Diagram
Time needed: 10 minutes
Here are the steps in developing the college management system deployment diagram.
- Determine the diagram’s purpose.
To determine the purpose of the deployment diagram, know the description of the system. The purpose of the deployment diagram is to design the needed components (software and hardware) of the system. This is to support and imply the whole processes when the college management system operates.
- Add the diagram’s nodes.
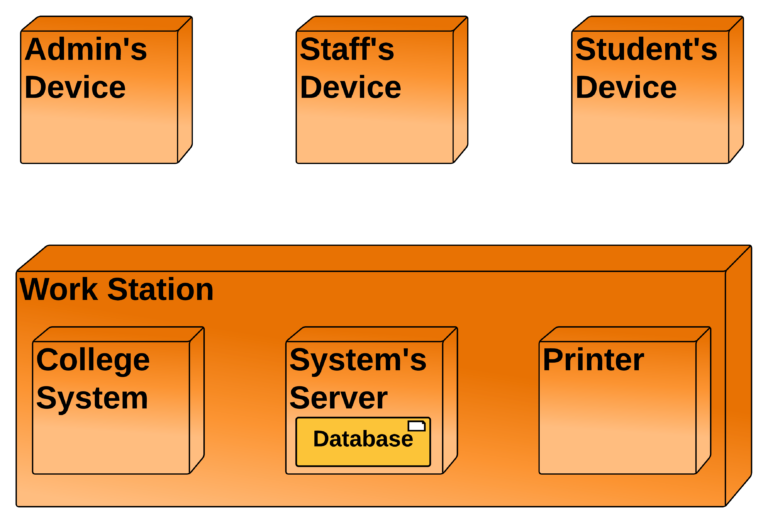
The term “node” refers to the physical devices that make up the system. Artifacts are deployed on these nodes. Node instances on which artifact instances will be implemented are also possible.

The essential software or hardware elements, or nodes, in the system are represented by the three-dimensional boxes known as nodes. The smaller forms included within the boxes reflect the software artifacts that are distributed, and the lines from node to node indicate relationships. - Add more pieces to the diagram, such as components or artifacts, if needed.
A deployment diagram depicts the locations of components and artifacts in the deployed system. In a software system, artifacts are model elements that reflect physical entities. Executable files, libraries, software components, documents, and databases are examples of physical implementation units.
- Add communication associations.
A communication association (path) is a sort of relationship between nodes in a deployment diagram that indicates how they communicate messages and signals in UML modeling. Deploy relationships in UML show that a certain type of node can be used to deploy a certain type of artifact.

A message or other sort of communication between nodes is indicated by a line called a relation or association.
Additional Knowledge
The topology of the physical components of a system, where the software components are installed, is visualized using deployment diagrams. Deployment diagrams are used to depict a system’s static deployment view. Nodes and their relationships are depicted in deployment diagrams.
The Deployment Model shows how components will be distributed across the system architecture in detail. It contains information about network capabilities, server specifications, hardware requirements, and other aspects of the planned system’s deployment.
Conclusion
You need to know the diagrams used to design and develop the College Management System. That is because you cannot perfectly create a fully-functional system without it. But if you create this deployment diagram, you will know the software and hardware components that the project should possess. Not only that, you will find out the needed specifications and connect them to the other UML Diagrams.
The deployment diagram is used to model the system’s physical architecture. It describes the connections of components between software and hardware system. By completing the Diagrams per module or per process, you will easily achieve your desired system. Check out our Related and Recommended Articles for more Learning and Information.
Related Articles:
- Online Food Ordering System Deployment Diagram
- Deployment Diagram for Banking System
- Learning Management System Deployment Diagram
- Deployment Diagram for Hotel Management System
- Deployment Diagram for Airline Reservation System
Recommended Articles from the Author:
- College Management System Project UML Diagrams
- College Management System Project Report
- College Management System Class Diagram
- College Management System ER Diagram
- College Management System Use Case Diagram
Inquiries
If you have inquiries or suggestions about Deployment Diagram for College Management System, just leave us your comments below. We would be glad to hear to concerns and suggestions and be part of your learning.
Keep us updated and Good day!
Official documentation
Working source code for this system
Download the actual implementation of this system in your preferred language. Each project includes source code, database, and setup instructions for BSIT capstone use.
- PHP: Car Driving School Management System in PHP with Source Code
- VB.NET: School Management System Version 3.0 in VB.net with Source Code
- Java: University Management System Project in Java With Source Code
- Python: College Management System Using Django with Source Code
- Django: College Management System Using Django with Source Code
- Laravel: School Management System in Laravel With Source Code
Frequently asked questions
What is a deployment diagram used for in BSIT capstone?
A deployment diagram shows the physical architecture: hardware nodes (servers, devices), the software components deployed on each, and the communication paths between them. It goes in Chapter 3 for systems with distributed components.
What tool should I use to draw the deployment diagram?
Free options: draw.io (browser-based, saves to Google Drive), Lucidchart free tier, PlantUML (text-based, version-controllable), StarUML (30-day trial then reduced feature set), Visual Paradigm Community Edition. Paid options: Microsoft Visio, Lucidchart pro, Enterprise Architect. For BSIT capstones, draw.io is the most commonly used free tool.
How detailed does the deployment diagram need to be for capstone defense?
Panel members expect the diagram to match the actual system implementation. Include every major class/use case/entity relevant to the system. Omit trivial helper classes. Every diagram element should have a clear justification. Aim for 1-2 diagrams that fully cover the system, not many partial ones.
Should I use black-and-white or colored diagrams?
Black-and-white is standard for capstone documentation to match the thesis format. Use color only if it improves clarity (e.g., grouping subsystems). Ensure text is readable at printed size (10pt minimum for labels).
Where does this diagram go in the capstone documentation?
Chapter 3 (System Design and Methodology) typically holds all UML diagrams. Introduce each diagram with a 1-paragraph description explaining what it shows and how to read it. Reference specific elements in the surrounding text so panel members can follow the design rationale.

Mary Grace G. Patulada
Programmer & Technical Writer at PIES IT Solution
Mary Grace G. Patulada (pen name ‘Nym’) is a programmer and writer at PIES IT Solution with a BSIT background from Carlos Hilado Memorial State College, Binalbagan Campus. Authored 370+ UML diagram tutorials and capstone documentation guides at itsourcecode.com. Specializes in UML (class, use case, activity, sequence, component, deployment), DFD, and ER diagrams for BSIT capstone projects.
Expertise: UML Diagrams · DFD · ER Diagrams · Use Case Diagrams · Activity Diagrams · Capstone Documentation · PHP · View all posts by Mary Grace G. Patulada →