Real-time plate Number Detection using OpenCV in Python with Source Code
The Real-Time Plate Number Detection OpenCV was developed using Python OpenCV, License Plate Recognition is an image-processing technology used to identify vehicles by their license plates.
This technology is used in various security and traffic applications.
A Plate Number Detection OpenCV Python aims to recognize license number plates. In order to detect license number plates, we will use OpenCV to identify number plates and Python pytesseract to extract characters and digits from the number plates.
This Python OpenCV Project also includes a downloadable source code for free, just find the downloadable source code below and click to start downloading.
By the way, if you are new to Python programming and don’t know how to use the Python IDE, I have here a list of the Best Python IDE for Windows, Linux, and Mac OS that will suit you.
I also have here How to Download and Install the Latest Version of Python on Windows.
To start executing Real-Time Plate Number Detection With Source Code, make sure that you have installed Python 3.9 and PyCharm on your computer.
How to run the Real-Time Plate Number Detection using OpenCV in Python: A step-by-step Guide With Source Code
Time needed: 5 minutes
These are the steps on how to run Real-Time Plate Number Detection OpenCV Python With Source Code
- Step 1: Download the given source code below.
First, download the given source code below and unzip the source code.

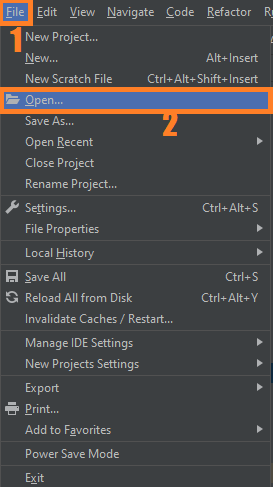
- Step 2: Import the project to your PyCharm IDE.
Next, import the source code you’ve downloaded to your PyCharm IDE.

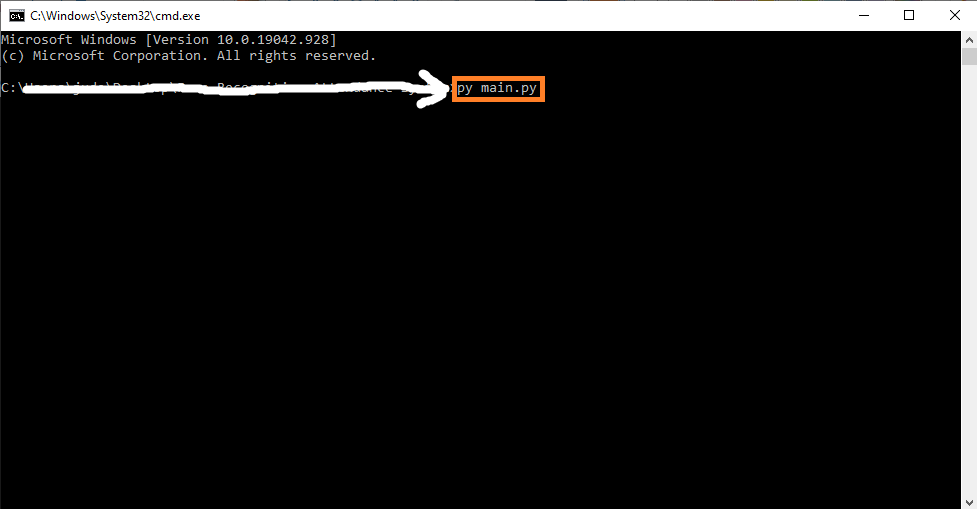
- Step 3: Run the project.
Lastly, run the project with the command “py main.py”

Installed Libraries
from skimage.io import imread
from skimage.filters import threshold_otsu
import matplotlib.pyplot as plt
import imutils
import cv2

from skimage import measure
from skimage.measure import regionprops
import matplotlib.pyplot as plt
import matplotlib.patches as patches
import os
import shutil
Complete Source Code
from skimage.io import imread
from skimage.filters import threshold_otsu
import matplotlib.pyplot as plt
import imutils
import cv2

from skimage import measure
from skimage.measure import regionprops
import matplotlib.pyplot as plt
import matplotlib.patches as patches
import os
import shutil
filename = './plate.mp4'

if os.path.exists('output'):
    shutil.rmtree('output')

os.makedirs('output')

cap = cv2.VideoCapture(filename)
# cap = cv2.VideoCapture(0)
count = 0
while cap.isOpened():
    ret,frame = cap.read()
    if ret == True:
        cv2.imshow('window-name',frame)
        cv2.imwrite("./output/frame%d.jpg" % count, frame)
        count = count + 1
        if cv2.waitKey(10) & 0xFF == ord('q'):
            break
    else:
        break
cap.release()
cv2.destroyAllWindows()
#
# car image -> grayscale image -> binary image
car_image = imread("./output/frame%d.jpg"%(count-1), as_gray=True)
car_image = imutils.rotate(car_image, 270)
# car_image = imread("car.png", as_gray=True)
# it should be a 2 dimensional array
print(car_image.shape)

# the next line is not compulsory however, a grey scale pixel
# in skimage ranges between 0 & 1. multiplying it with 255
# will make it range between 0 & 255 (something we can relate better with

gray_car_image = car_image * 255
fig, (ax1, ax2) = plt.subplots(1, 2)
ax1.imshow(gray_car_image, cmap="gray")
threshold_value = threshold_otsu(gray_car_image)
binary_car_image = gray_car_image > threshold_value
# print(binary_car_image)
ax2.imshow(binary_car_image, cmap="gray")
# ax2.imshow(gray_car_image, cmap="gray")
plt.show()

# CCA (finding connected regions) of binary image


# this gets all the connected regions and groups them together
label_image = measure.label(binary_car_image)

# print(label_image.shape[0]) #width of car img

# getting the maximum width, height and minimum width and height that a license plate can be
plate_dimensions = (0.03*label_image.shape[0], 0.08*label_image.shape[0], 0.15*label_image.shape[1], 0.3*label_image.shape[1])
plate_dimensions2 = (0.08*label_image.shape[0], 0.2*label_image.shape[0], 0.15*label_image.shape[1], 0.4*label_image.shape[1])
min_height, max_height, min_width, max_width = plate_dimensions
plate_objects_cordinates = []
plate_like_objects = []

fig, (ax1) = plt.subplots(1)
ax1.imshow(gray_car_image, cmap="gray")
flag =0
# regionprops creates a list of properties of all the labelled regions
for region in regionprops(label_image):
    # print(region)
    if region.area < 50:
        #if the region is so small then it's likely not a license plate
        continue
        # the bounding box coordinates
    min_row, min_col, max_row, max_col = region.bbox
    # print(min_row)
    # print(min_col)
    # print(max_row)
    # print(max_col)

    region_height = max_row - min_row
    region_width = max_col - min_col
    # print(region_height)
    # print(region_width)

    # ensuring that the region identified satisfies the condition of a typical license plate
    if region_height >= min_height and region_height <= max_height and region_width >= min_width and region_width <= max_width and region_width > region_height:
        flag = 1
        plate_like_objects.append(binary_car_image[min_row:max_row,
                                  min_col:max_col])
        plate_objects_cordinates.append((min_row, min_col,
                                         max_row, max_col))
        rectBorder = patches.Rectangle((min_col, min_row), max_col - min_col, max_row - min_row, edgecolor="red",
                                       linewidth=2, fill=False)
        ax1.add_patch(rectBorder)
        # let's draw a red rectangle over those regions
if(flag == 1):
    # print(plate_like_objects[0])
    plt.show()


if(flag==0):
    min_height, max_height, min_width, max_width = plate_dimensions2
    plate_objects_cordinates = []
    plate_like_objects = []

    fig, (ax1) = plt.subplots(1)
    ax1.imshow(gray_car_image, cmap="gray")

    # regionprops creates a list of properties of all the labelled regions
    for region in regionprops(label_image):
        if region.area < 50:
            #if the region is so small then it's likely not a license plate
            continue
            # the bounding box coordinates
        min_row, min_col, max_row, max_col = region.bbox
        # print(min_row)
        # print(min_col)
        # print(max_row)
        # print(max_col)

        region_height = max_row - min_row
        region_width = max_col - min_col
        # print(region_height)
        # print(region_width)

        # ensuring that the region identified satisfies the condition of a typical license plate
        if region_height >= min_height and region_height <= max_height and region_width >= min_width and region_width <= max_width and region_width > region_height:
            # print("hello")
            plate_like_objects.append(binary_car_image[min_row:max_row,
                                      min_col:max_col])
            plate_objects_cordinates.append((min_row, min_col,
                                             max_row, max_col))
            rectBorder = patches.Rectangle((min_col, min_row), max_col - min_col, max_row - min_row, edgecolor="red",
                                           linewidth=2, fill=False)
            ax1.add_patch(rectBorder)
            # let's draw a red rectangle over those regions
    # print(plate_like_objects[0])
    plt.show()
Download the Source Code below
Summary
In this article, we have developed a deep-learning project to recognize license number plate.
We discussed some important features of OpenCV like Gaussian blur, Sobel operators, and Morphological transformations.
The application detects number plate text from an image. We have identified and cleaned the number plate using openCV. To identify the number plate digits and characters we used pytesseract.
Related Articles
- Code For Game in Python: Python Game Projects With Source Code
- Best Python Projects With Source Code FREE DOWNLOAD
- How to Make a Point of Sale In Python With Source Code
- Python Code For Food Ordering System | FREE DOWNLOAD
- Inventory Management System Project in Python With Source Code
Inquiries
If you have any questions or suggestions about Real-Time Plate Number Detection OpenCV Python With Source Code, please feel free to leave a comment below.


