
The College Library Management System ER Diagram reveals the relationships between college library entity sets in a database. This displays the logical structure of databases. It is done by identifying entities, their properties, and the interactions between them.
The College Library Management System database design is sketched out using ER diagrams. This database sketch for college library management system is made up of entities, their attributes, and their relationships.
College Library Management System ER Diagram: Details
The table shows the name and details of College Library Management System ER Diagram. It has a complete description of the project’s information.
| Name: | College Library Management System ER Diagram |
| Abstract: | College Library Management System ER Diagram depicts the relationship between various entities. It can be thought of as a blueprint for your system (project) structure. |
| Diagram: | ER Diagram is also known as Entity Relationship Diagram |
| Users: | School Librarian, Student (Book Borrowers), and School Admin |
| Tools Used: | Diagraming tools that provide ER diagram symbols. |
| Designer: | ITSourceCode.com |
College Library Management System
A college library management project is one that electronically organizes and maintains book information for students’ use.
The approach makes it easier for students and the librarian to keep track of all the books that are currently available in the library. It enables both the learner and the administrator to look up the appropriate book.
What is an ER Diagram?
The College Library Management System ER Diagram is referred to as the software database design. This ER Diagram is the graphical depiction of relationships between all the entities involved in the system. Its major components are Entities, Attributes, and Relationships.
Importance of ER Diagram
The importance of ER Diagram for College Library Management System is that it helps in modeling its data storage or database. It is the basis of the project’s database foundation for construction.
This entity-relationship diagram (ERD) also aids in defining the data types to be stored such as their attributes and characteristics.
Users of College Library Management System ER Diagram
The users of College Library Management System ER Diagram are the following:
- School Librarian: The school librarians will be the ones to use the system most of the time. They will monitor the books from time to time and will cater to the borrowing and returning of books. They were also responsible for all the activities related to the library.
- Book Borrowers: Book borrowers were not just the students but also the professors or instructors. They will also have access to the system and to do that, they will have to log into the system. This will help the librarian and the admin monitor the book borrowers.
- School Admin: The Library Management System can be a stand-alone project or a part of a bigger project. Nevertheless, it always has the admin which can access all of the library information. This is done when there’s a serious scenario or problem.
ER Diagram for Library Management System with Tables
These tables below provide the complete database table details such as Field Name, Descriptions, data types, and character lengths.
Table Name: Student
| Field | Description | Type | Length |
| stud_ID (PK) | Student ID | Int | 11 |
| fname | Student First Name | Varchar | 255 |
| lname | Student Last Name | Varchar | 255 |
| gender | Student Gender | Int | 11 |
| age | Student Age | Int | 11 |
| contact_add | Contact Address | Int | 11 |
| stud_email | Student Email | Varchar | 255 |
| stud_pass | Student Password | Varchar | 255 |
Table Name: Users
| Field | Description | Type | Length |
| user_ID (PK) | User ID | Int | 11 |
| fname | Instructor First Name | Varchar | 255 |
| lname | Instructor Last Name | Varchar | 255 |
| gender | Instructor Gender | Int | 11 |
| age | Instructor Age | Int | 11 |
| contact_add | Contact Address | Int | 11 |
| user_email | User Email | Varchar | 255 |
| user_pass | User Password | Varchar | 255 |
Table Name: Book
| Field | Description | Type | Length |
| book_ID (PK) | Book ID | Int | 11 |
| bk_title | Book Title | Varchar | 30 |
| bk_name | Book Name | Varchar | 30 |
| publisher | Publisher | Varchar | 30 |
| author | Author | Varchar | 30 |
| bk_num | Book Number | Int | 11 |
| pub_date | Date Published | Date |
Table Name: Borrowing
| Field | Description | Type | Length |
| borrowing_ID (PK) | Borrowing ID | Int | 11 |
| book_ID (FK) | Book ID | Int | 11 |
| stud_ID (FK) | Student ID | Int | 11 |
| date_borrowed | Borrowing Date | Date | |
| date_return | Returning Date | Date |
Table Name: Transaction
| Field | Description | Type | Length |
| trans_ID (PK) | Transaction ID | Int | 11 |
| trans_name | Transaction Name | Varchar | 30 |
| borrowing_ID (FK) | Subject ID | Int | 11 |
| stud_ID (FK) | Student ID | Int | 11 |
| trans_date | Date of Transaction | Date |
Table Name: Reports
| Field | Description | Type | Length |
| report_ID (PK) | Report ID | Int | 11 |
| trans_ID (FK) | Transaction ID | Int | 11 |
| borrowing_ID (FK) | Borrowing ID | Int | 11 |
| report_date | Report Date | Date |
College Library Management System ER Diagram
ER Diagram of College Library Management System shows the system entity and the supposed functions in each relationship.
The Relational Model for College Library Management System shows the supposed database design of the project. It conveys the data that would be present in the college library system, its characteristics, and its connection with other data (entity).
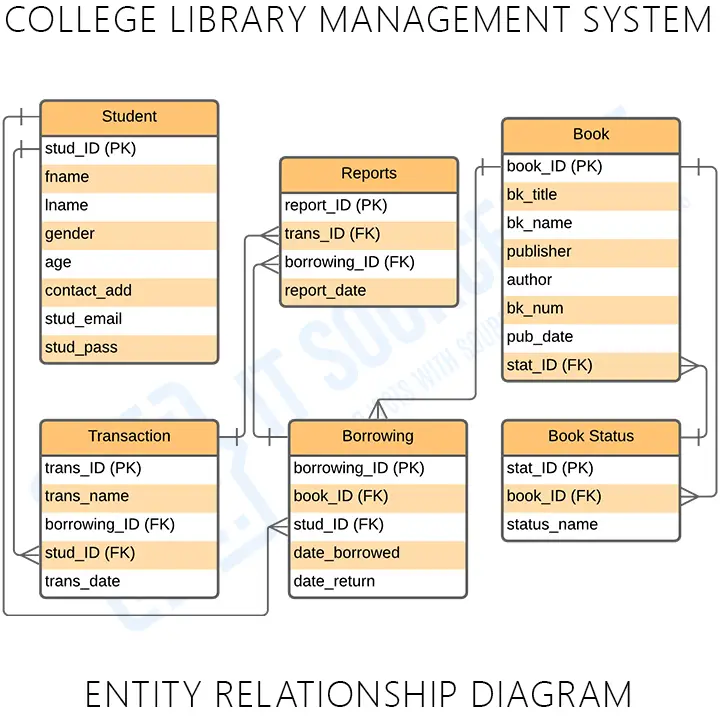
This diagram presents the Entities’ Relational Model for College Library Management System. It is used to enlighten you on how the back end of the database of the project works.
The tables are made to meet the required specification of the system and provide much more specific details of each entity within the system.
ER Diagram for Library Management System of College [PDF]
The ER Diagram for Library Management System PDF provides the information explaining the concepts of the project database. You may apply this information to your capstone project. You can also use it directly or modify its content depending on your project’s requirements.
The PDF File of College Library Management System is provided for you to have your reference. Through this PDF file, you can modify the diagram or use the diagram in your project. This Entity Relationship Diagram for Library Management System of College was given for free.
How to build ER Diagram for College Library Management System with Cardinality Ratio
Time needed: 5 minutes
Steps in building the ER Diagram for College Library Management System with Cardinality Ratio.
- Step 1: Familiarize the ER Diagram (Entity Relationship Diagram) Symbols and Cardinality
Entity Relationship Diagram – shows the structure of data types in a project. It uses symbols to clarify its parts and relationships. Their symbols and applications must be familiarized before you build the ER Diagram.
ER Diagram Symbols:
• Fields: Fields are the parts of a table that define the entity’s characteristics. In the database that the ERD models, attributes are commonly thought of as rows.
• Keys is a technique to categorize data qualities. It is used to organize ER diagrams and assist users in modeling their databases to ensure that they are efficient. This is also used to connect different tables in a database.
– Primary Key: identifies a single entity instance which means a unique attribute or set of attributes.
– Foreign Key: is produced when data attributes have one too many relationships with other entities. - Step 2: Determine the targeted users
After the symbol familiarization, you’ll need to determine your targeted users. Your targeted users will be the ones to use your project.
- Step 3: Analyze the entities and their included attributes
Analyzation is very important in creating ER diagram. It will help you understand the work of the diagram and avoid unwanted errors.
- Step 4: Plot the Entity Relationship Diagram
To plot the ERD you will need the entities, their attributes, and relationships. You will base the data structure from the evaluated information to have the exact Entity Relationship Diagram.
Conclusion:
You need to know the diagrams used to design and develop the College Library Management System. That is to help you create a fully-functional system with the use of ER Diagram. Creating it will help you perceive the back end of the software. This will hold all the data that’ll enter and exit the system.
Related Articles:
- College Management System ER Diagram
- School Management System ER Diagram
- University Management System ER Diagram
- Barangay Information System ER Diagram
- ER Diagram for Online Ordering System
Recommended Articles:
- Library Management System DFD
- Library Management System Use Case Diagram
- Library Management System Activity Diagram
- Library Management System Sequence Diagram
- Library Management System UML Diagrams
Inquiries
If you have inquiries or suggestions about College Library Management System ER Diagram, just leave us your comments below. We would be glad to know to concerns and suggestions and be part of your learning.
Keep us updated and Good day!