
Deployment Diagram for ATM System
UML deployment diagram for ATM system is able to define how the software and hardware work and where the processing takes place. The needed hardware and software specifications of the ATM system are visualized using deployment diagrams. It is one of the structural diagrams which describes the physical aspects of a real-world project.
The Deployment Diagram is a sort of UML model that depicts the ATM system’s execution architecture. It includes nodes such as hardware or software execution environments and their relationships. This shows included PCs and other devices for hardware, OS and applications for software, and TCP/IP and other connection forms for their connections.
ATM System Deployment Diagram: Table of Contents
- Deployment Diagram for ATM System
- Deployment Diagram for ATM System: Project Details
- ATM System Deployment Diagram Description
- Deployment Diagram for ATM System in UML
- ATM System UML Deployment Diagram (Explanation)
- Deployment Diagram for ATM System (PDF)
- Elements used in Creating your Deployment Diagram
- Benefits of UML Deployment Diagram
- Conclusion:
- Recommended Articles from the Author:
- Inquiries
Deployment Diagram for ATM System: Project Details
The table shows the basic details ATM system deployment diagram. It has quick description details of the project.
| Name: | ATM System Deployment Diagram |
| Abstract: | The ATM System Deployment Diagram represents the physical structure of the project. It reveals the software and hardware included in order for ATM to work correctly. |
| UML Diagram: | Deployment Diagram |
| Users: | Bank Admin, ATM Card Holders, and Bank Clients |
| Tools Used: | Diagraming Tools that have UML Deployment Diagram Symbols |
| Designer: | ITSourceCode.com |
ATM System Deployment Diagram Description
Deployment diagrams demonstrate how software and hardware communicate to ensure appropriate ATM system operation. It properly explains how software interacts with hardware. They also help figure out which a certain type of hardware uses software parts.
According to Guru99.com, the main aim of deployment diagrams is to describe how software is delivered into the hardware system. It depicts how software interacts with hardware to perform all of the functions. It’s a term that describes how software interacts with hardware and vice versa.
Deployment Diagram for ATM System in UML
A deployment diagram for the ATM system in UML is used to illustrate its’ physical architecture. In UML, deployment diagrams can show you how the software and hardware of the ATM system work together and where the processing takes place.
ATM System uses a UML deployment diagram to show how should the developed software be deployed. It clarifies the communications between links(nodes) which helps the project to work according to the design given to it.
Deployment Diagram for ATM System
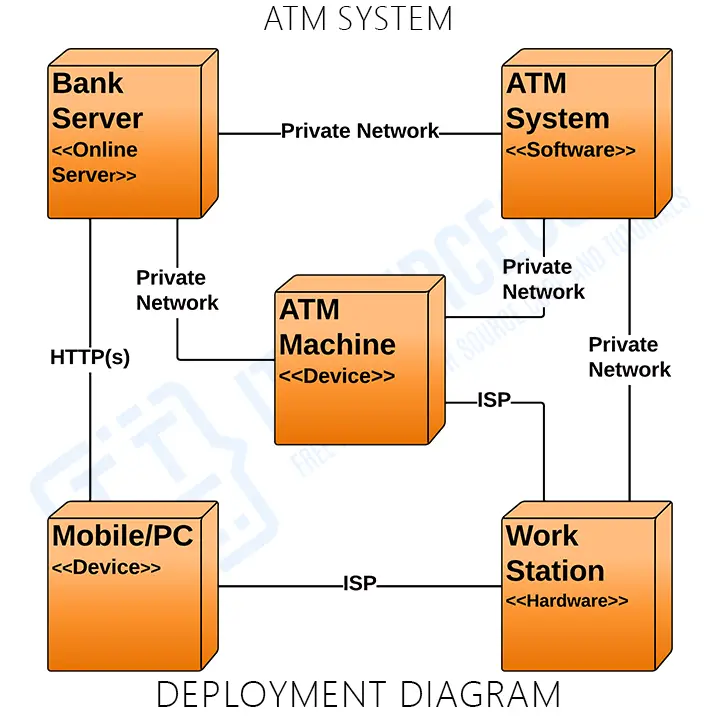
Here’s the Deployment Diagram for ATM System. It shows a detailed illustration of the system’s software and hardware specification. Additionally, it gives you the complete physical structure of the ATM system that is needed in its deployment for its users.
ATM System UML Deployment Diagram (Explanation)
The ATM system UML deployment diagram explains the sketch of the relationship between software and hardware. The hardware and software are labeled to clarify their part in the system’s operation. They were represented by nodes and the connections were represented by labeled arrows.
The deployment diagram shows the scenario when the ATM system is deployed. It has 5 nodes represented by boxes and relationship connections. The nodes are the Bank Server, ATM Machine, ATM System, Mobile/PC, and the Work Station.
For the connection, the software is connected to an ISP that enables it to pass data to the webserver and then will be accessed by the users thru browsers with the use of URLs. Then the workstation can access the software with the use of a private network and they can communicate with users using ISP.
Deployment Diagram for ATM System (PDF)
You may download the Deployment Diagram PDF by clicking the button below. It has the full details and discussion on System’s Deployment Diagram. You can also modify its content to complete your project requirements and needs.
Elements used in Creating your Deployment Diagram
Here are some elements used in creating your deployment diagram by Lucidchart. Deployment diagrams come in a number of shapes. Most of these things are shown in the graphic below, and this list gives you a general idea of what you might see.
- Artifact : A rectangle with the name and term “artifact” enclosed by two arrows represents a software-created product.
- Association : A message or other sort of communication between nodes is indicated by a line.
- Component : A rectangle with two tabs that indicate a software part is called a component.
- Dependency : A dashed line that ends in an arrow denotes the dependency of one node or component on another.
- Interface : A contract relationship is indicated by a circle. Those items that realize the interface are required to fulfill some sort of task.
- Node : A three-dimensional box represents a hardware or software object.
- Node as Container : This is a node that has another node within it, such as the nodes that contain components.
- Stereotype : A device housed within the node, displayed at the top of the node and flanked by two arrows.
Steps in creating Deployment Diagram for ATM System
Time needed: 5 minutes
Here are the steps in creating the deployment diagram for ATM System. In creating this deployment diagram, we used lucidchart.com
- Step 1: Open your Diagramming tool.
When you open the tool, you may see a blank page. It has several buttons at the top of the page and on the bottom. You can use any tool which will make you comfortable. It is up to you what diagram you want to use. You can draw it manually if you like.
You can use any diagramming tool as long as it provides the deployment diagram symbols or elements. These are the artifacts, association, component, dependency, interface, node, etc. This is to make your diagram complete and detailed.
You just have to search for the UML Deployment on the search bar of your tool which looks like this.
After that, pin the Deployment Diagram Shapes and Symbols to make it viewable in your workspace. - Step 2: Finalize the Nodes (Software and Hardware)
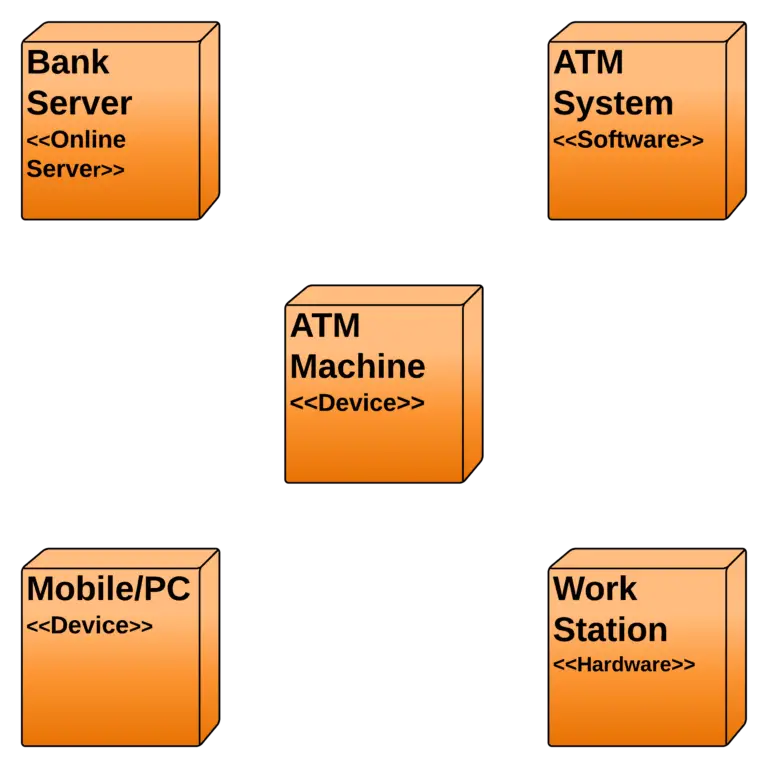
The second step in creating your deployment diagram is finalizing the projects’ hardware and software specifications. Then you will plot them wisely, giving space for the arrows that will determine their connections. This step will look like this.
The nodes presented here simply show the possible hardware and software needed for the ATM system to operate. These nodes are composed of users’ devices (hardware) and applications (software).
The admin’s device holds the ATM system (software) and is held online to enable users to access the software online. The users that can access the system have their information uploaded to the server. It will serve as their qualifications to login into the system. The devices of the users are also considered nodes. - Step 3: Map the Connections between Nodes
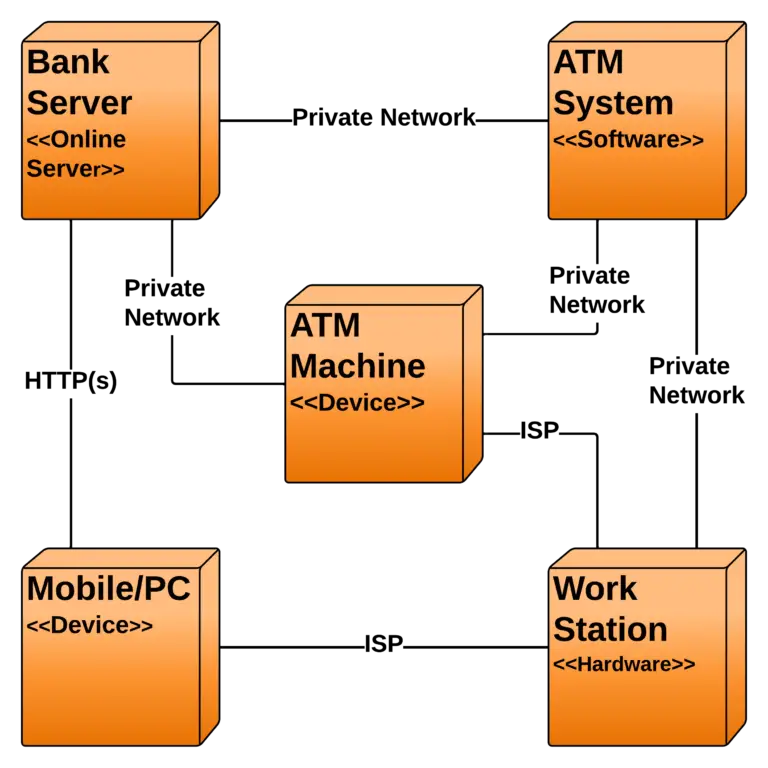
Finally, you will map the arrows that will emphasize the connections of nodes. These connections should be labeled to know the form of relationship used between nodes. The common connections are forms of Networking connections and others.
Benefits of UML Deployment Diagram
They visualize a system’s hardware processors/nodes/devices, communication linkages between them, and software file layout on that hardware.
- It aids in the visualization of the various aspects involved.
- Aids in a more accurate description of all the hardware elements used by software components.
- It clarifies the description of the runtime involved in processing nodes.
- Provides hardware specified details for the distributed application.
- Helps in modeling the system’s hardware topology.
- It aids in the modeling of inserted or included software.
- Provides more information on the hardware system.
- Reverse engineering is made easier using the UML deployment diagram.
Additional Knowledge
The topology of the physical components of a system, where the software components are installed, is visualized using deployment diagrams. Deployment diagrams are used to depict a system’s static deployment view. Nodes and their relationships are depicted in deployment diagrams.
The Deployment Model shows how components will be distributed across the system architecture in detail. It contains information about network capabilities, server specifications, hardware requirements, and other aspects of the planned system’s deployment.
Conclusion:
It is essential for you to know the diagrams used to design and develop the ATM system. That is because you cannot perfectly create a fully-functional system without it. But if you make this deployment diagram, you will know the software and hardware components that the project should possess. Not only that, you will find out the needed specifications and connect them to the other UML Diagrams.
The deployment diagram is used to model the system’s physical architecture. It describes the connections of components between software and hardware system. By completing the Diagrams per module or process, you will easily achieve your desired system. Check out our Related and Recommended Articles for more Learning and Information.
Related Articles:
- Deployment Diagram for Online Shopping System
- Deployment Diagram for Library Management System
- Deployment Diagram for Hospital Management System
Recommended Articles from the Author:
- ATM System UML Diagrams
- ATM System Class Diagram
- ATM System Sequence Diagram
- ATM Management System Activity Diagram
- ATM Management System ER Diagram
- ATM System Use Case Diagram
- ATM Management System Data Flow Diagram
Inquiries
If you have inquiries or suggestions about Deployment Diagram for ATM System, just leave us your comments below. We would be glad to hear to concerns and suggestions and be part of your learning.
Keep us updated and Good day!
Official documentation
Working source code for this system
Download the actual implementation of this system in your preferred language. Each project includes source code, database, and setup instructions for BSIT capstone use.
- PHP: Online Blood Bank Management System in PHP with Source Code
- VB.NET: Test Bank System of Kabankalan Catholic College
- Java: Bank Management System Project In Java NetBeans Source Code
- Python: Bank Management System Project in Django with Source Code
- Django: Bank Management System Project in Django with Source Code
- Laravel: Online Banking Management System Project in Laravel with Source Code
Frequently asked questions
What is a deployment diagram used for in BSIT capstone?
A deployment diagram shows the physical architecture: hardware nodes (servers, devices), the software components deployed on each, and the communication paths between them. It goes in Chapter 3 for systems with distributed components.
What tool should I use to draw the deployment diagram?
Free options: draw.io (browser-based, saves to Google Drive), Lucidchart free tier, PlantUML (text-based, version-controllable), StarUML (30-day trial then reduced feature set), Visual Paradigm Community Edition. Paid options: Microsoft Visio, Lucidchart pro, Enterprise Architect. For BSIT capstones, draw.io is the most commonly used free tool.
How detailed does the deployment diagram need to be for capstone defense?
Panel members expect the diagram to match the actual system implementation. Include every major class/use case/entity relevant to the system. Omit trivial helper classes. Every diagram element should have a clear justification. Aim for 1-2 diagrams that fully cover the system, not many partial ones.
Should I use black-and-white or colored diagrams?
Black-and-white is standard for capstone documentation to match the thesis format. Use color only if it improves clarity (e.g., grouping subsystems). Ensure text is readable at printed size (10pt minimum for labels).
Where does this diagram go in the capstone documentation?
Chapter 3 (System Design and Methodology) typically holds all UML diagrams. Introduce each diagram with a 1-paragraph description explaining what it shows and how to read it. Reference specific elements in the surrounding text so panel members can follow the design rationale.

Mary Grace G. Patulada
Programmer & Technical Writer at PIES IT Solution
Mary Grace G. Patulada (pen name ‘Nym’) is a programmer and writer at PIES IT Solution with a BSIT background from Carlos Hilado Memorial State College, Binalbagan Campus. Authored 370+ UML diagram tutorials and capstone documentation guides at itsourcecode.com. Specializes in UML (class, use case, activity, sequence, component, deployment), DFD, and ER diagrams for BSIT capstone projects.
Expertise: UML Diagrams · DFD · ER Diagrams · Use Case Diagrams · Activity Diagrams · Capstone Documentation · PHP · View all posts by Mary Grace G. Patulada →