
The DFD for the University Management System is created to show the overall flow of data within the university.
It provides various illustrations to describe the data (input and output) movements of the overall process of the university.
In addition, always remember that DFD is not part of the University Management System UML Diagrams.
However they have differences from each other in the project activities, behaviors, interactions, and structure.
The University Management System DFD consists of three main levels.
- 0 Level DFD for University Management System
- 1 Level DFD – University Management System
- 2 Level DFD – University Management System
0 Level DFD for University Management System
The 0th level of the University DFD (data flow diagram) is also known as the context diagram. Its primary concept is to show the system’s main function in a single process.
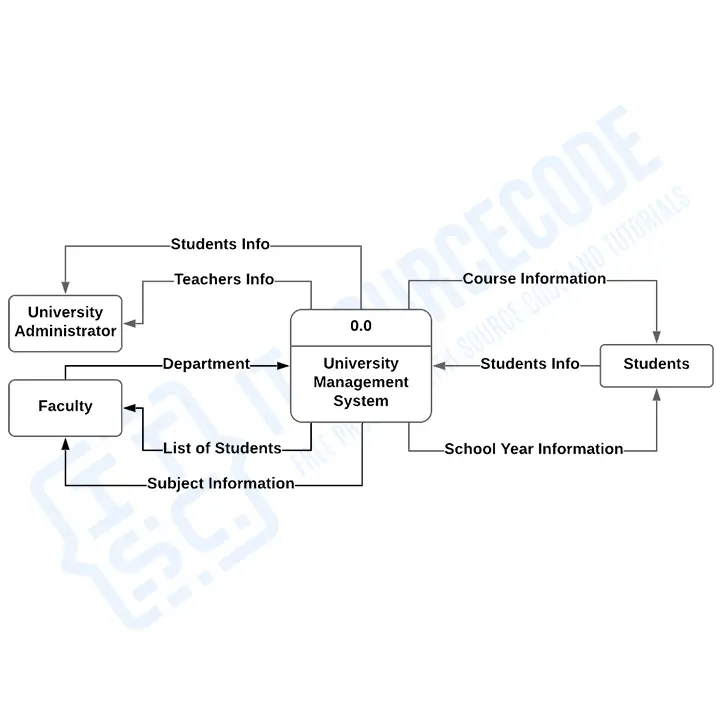
To set the scene for the project, the illustration shows the main process as a single node. This context makes it clear at a glance how the project works.
The user puts information into the system and then gets what it comes up with.
In addition to this, you can see from the data flow diagrams DFD is already happening. Even though the process is very broad, it is clear how data moves through it.
In the above example, the diagram highlighted the main process, users (external entities), and data flow.
For the university system’s external entities, we have:
- University Administrator
- Teachers
- Students
Though these entities are part of the system process, they are called “external” because they are outside the project’s scope.
Remember: You can change this diagram to fit the project’s needs and add other features that help in running a university.
1 Level DFD – University Management System
The 1st level of the system’s DFD describes each of the primary sub-processes that comprise the whole system. This level represents the context diagram’s “extended viewpoint”.
This level illustrates the data flow from input to output and the transformations that occur along the way.
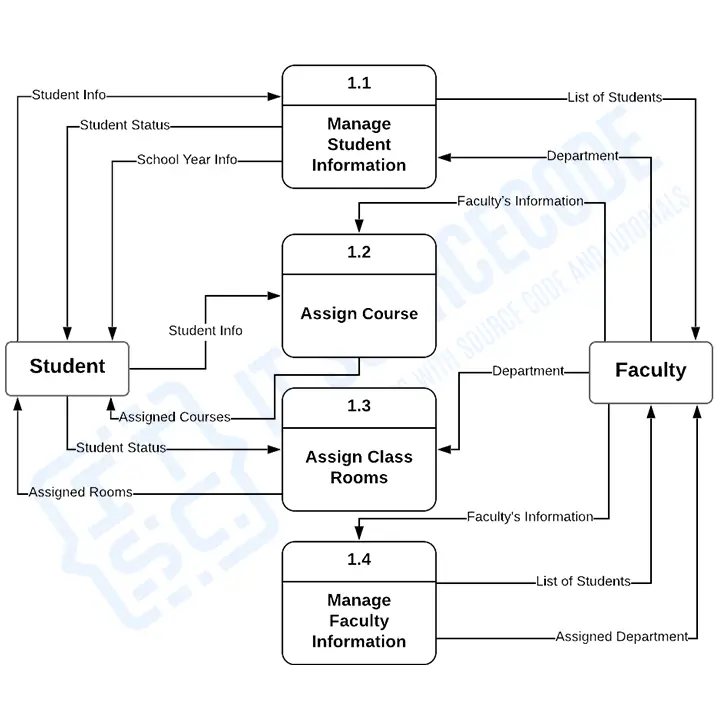
This level also explains the single process by emphasizing its sub-processes, which include:
- Manage Student Information
- Assign Course
- Assign Class Rooms
- Manage Teachers
Managing student information is part of the university management process. This process does the gathering of data from students and stores them in the system.
A student will provide information, then the data flow from the student to the “manage student information” process.
Assigning courses is a system feature that processes the designation of courses for every student.
Assigning Class Rooms is the process where the system automatically assigns the university’s classrooms.
This assignment varies on the total number of students per course and subject.
To manage teachers, the system gathers their information and credentials. These data will be filtered to assign them to their specific expertise.
Level 1 defines the university management system data flow diagram at a higher level than DFD level 0.
2 Level DFD – University Management System
The DFD level 2 method expands the level 1 method. It’s used to show or talk about important level-1 processes. As a result, this level is more advanced than DFD level 1.
However, this level is not required for all project sub-processes. Provide this diagram only if necessary. This is not required if your previous diagrams were clear and precise.
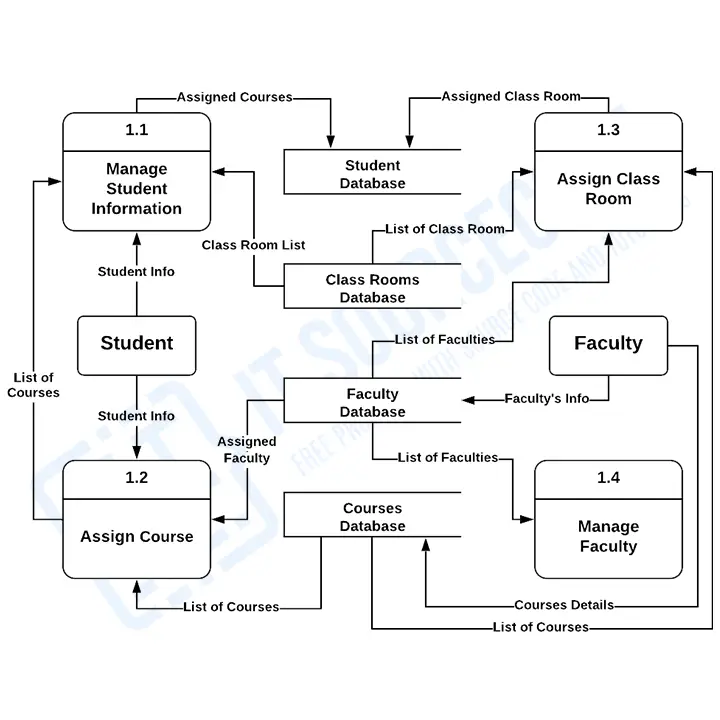
This example specifies the system data store (database). The university management system database holds all of the system inputs.
You will learn more about the system’s database through the university management system ERD (entity relationship diagram).
According to the diagram, the DFD level 2 has the following data store:
- Student Database
- Class Rooms Database
- Teachers Database
- Course Database
Remember: This level is only applicable if you need to address more sub-processes in level 1. This level can take many different illustrations, depending on how many sub-processes are emphasized.
Moreover, this level is optional in certain instances. As long as you can explain the system’s idea at levels 0 and 1, your data flow diagram will be excellent.
To draw your University management system data flow diagram, you may use the DFD-defined symbols and annotations.
University Management System Data Flow Diagram Pdf
You may download the Data Flow Diagram for the University Management System Project PDF by clicking the button below.
It has the full details and discussion of the System’s Data Flow Diagram.
You can also modify its content to complete your project requirements and needs.
Conclusion
Levels 0, 1, and 2 of the DFD work together to show the exact flow of data through the system.
The context diagram shows how the university management system is used and what its main goals are.
It shows the whole process in one step so that the concept of the system is easy to understand.
How to read a data flow diagram
A DFD shows how data moves through the system. Unlike UML, DFD is not part of the UML standard but is standard in structured analysis and BSIT capstone documentation.
- Process. Circle or rounded rectangle representing a transformation of data.
- Data store. Open-ended rectangle or two parallel lines representing persistent storage.
- External entity. Rectangle outside the system representing a source or destination of data (users, external systems).
- Data flow. Arrow labeled with the data being moved.
DFD levels
- Level 0 (Context diagram). The entire system as a single process, with all external entities and the data they exchange.
- Level 1. Explodes the context process into 3-7 major sub-processes, still connected to the external entities.
- Level 2. Further decomposes each Level 1 process into detailed sub-processes.
- Level 3+. Rarely needed. Only for very complex systems.
Common capstone mistakes to avoid
- Skipping Level 0. Always start with the context diagram.
- Process with no output. Every process must produce data.
- Data flow between two external entities. Data flows must involve at least one process.
- Unbalanced levels. The inputs and outputs at Level N must match those at Level N-1.
- Missing data store labels. Every data store needs a name (usually the corresponding database table).
Where the DFD fits in Chapter 3
- Section 3.2 (System Analysis). Usually before the class or ER diagram.
- Include all levels 0-2 for a complete decomposition.
- Number each process (1.0, 1.1, 1.2, etc.) for easy reference.
Official documentation

Mary Grace G. Patulada
Programmer & Technical Writer at PIES IT Solution
Mary Grace G. Patulada (pen name ‘Nym’) is a programmer and writer at PIES IT Solution with a BSIT background from Carlos Hilado Memorial State College, Binalbagan Campus. Authored 370+ UML diagram tutorials and capstone documentation guides at itsourcecode.com. Specializes in UML (class, use case, activity, sequence, component, deployment), DFD, and ER diagrams for BSIT capstone projects.
Expertise: UML Diagrams · DFD · ER Diagrams · Use Case Diagrams · Activity Diagrams · Capstone Documentation · PHP
· View all posts by Mary Grace G. Patulada →
Working source code for this system
Download the actual implementation of this system in your preferred language. Each project includes source code, database, and setup instructions for BSIT capstone use.
- PHP: Car Driving School Management System in PHP with Source Code
- VB.NET: School Management System Version 3.0 in VB.net with Source Code
- Java: University Management System Project in Java With Source Code
- Python: College Management System Using Django with Source Code
- Django: College Management System Using Django with Source Code
- Laravel: School Management System in Laravel With Source Code
Frequently asked questions
What is a data flow diagram used for in BSIT capstone?
A data flow diagram shows how data moves through the system: processes, data stores, external entities, and data flows. Level 0 (context) shows the whole system as one process; Level 1 breaks it into major sub-processes; Level 2 details each sub-process.
What tool should I use to draw the data flow diagram?
Free options: draw.io (browser-based, saves to Google Drive), Lucidchart free tier, PlantUML (text-based, version-controllable), StarUML (30-day trial then reduced feature set), Visual Paradigm Community Edition. Paid options: Microsoft Visio, Lucidchart pro, Enterprise Architect. For BSIT capstones, draw.io is the most commonly used free tool.
How detailed does the data flow diagram need to be for capstone defense?
Panel members expect the diagram to match the actual system implementation. Include every major class/use case/entity relevant to the system. Omit trivial helper classes. Every diagram element should have a clear justification. Aim for 1-2 diagrams that fully cover the system, not many partial ones.
Should I use black-and-white or colored diagrams?
Black-and-white is standard for capstone documentation to match the thesis format. Use color only if it improves clarity (e.g., grouping subsystems). Ensure text is readable at printed size (10pt minimum for labels).
Where does this diagram go in the capstone documentation?
Chapter 3 (System Design and Methodology) typically holds all UML diagrams. Introduce each diagram with a 1-paragraph description explaining what it shows and how to read it. Reference specific elements in the surrounding text so panel members can follow the design rationale.
Very Nice Blog…Thanks for sharing this information with us. Here am
sharing some information about Our Software Company
Campus Management System
Very Nice Blog…Thanks for sharing this information with us. Here am
sharing some information about Our Software Company
Campus Management System in Malaysia
Very Nice Blog. Thanks For Sharing This Article Here I am Sharing Some Information About Our Software Services
College Management System in Malaysia
Very Nice Blog. Thanks For Sharing This Article Here I am Sharing Some Information About Our Software Services
Campus Management System in Malaysia