

The UML tutorial use case diagram is one of the UML diagrams that helps in emphasizing the important processes and flow of your project. Through this diagram, your readers and user will be able to understand the details of each processes and their function or work.
Moving on, the use case diagram can summarize the details of your system’s targeted users or also known as actors. Their interactions with the system in the Unified Modeling Language (UML).
What is the meaning of a USE CASE DIAGRAM?
It shows how a user would interact with your system boundary. Use case diagrams show the system’s use cases and users, and are often augmented by other diagrams. DFD, ERD, and others support UML use case ideas.
Know the BASIC COMPONENT of the USE CASES:
Before we draw a use case diagram both the GENERAL and the SPECIFIC, we must know and understand first its components. The components used in building our UML USE CASE DIAGRAMS ARE:
• the Use Cases – the use case are the ellipses or circle symbols. This symbol will illustrate the processes included in the system. It could also show the sub process from the main processes.
• the Actors – the actors are the users of the system. it could be single, dual or multiple depending on the scope of the system. the symbol of the actor are in a form of an icon showing a stick figures. It will help the readers as well as the users know their roles to the system.
• the System – the system comes with a rectangular container symbol. It holds all the processes included in the system and acts as the scope illustration.
• the Lines or Arrows – are the indication or connection to which will the process be connected.
How to create a USE CASE DIAGRAM?
To design a use case diagram, you must know its symbols and their function. Your use case must show the flow of your system, including scenarios, applications, and user interaction.
You also have to make sure that the requirements of a system project is well-explained and are met in the use case.
Use case diagrams UML are useful for:
• Representing the objectives of user-system interactions
• Defining and structuring a system’s functional requirements
• Defining a system’s context and needs
• The basic flow of events in a use case is modeled.
Here’s a video on Use Case Diagrams to help with your Capstone Project.
Now, let us start creating an example of a use case diagram UML. The first part in creating the use case is known as General Use Case Diagram and here are the illustrations:
Examples of Use Case Diagram as UML Sample
Time needed: 5 minutes
Here are the example of USE CASE DIAGRAMS that serves as samples for UML DIAGRAMS.
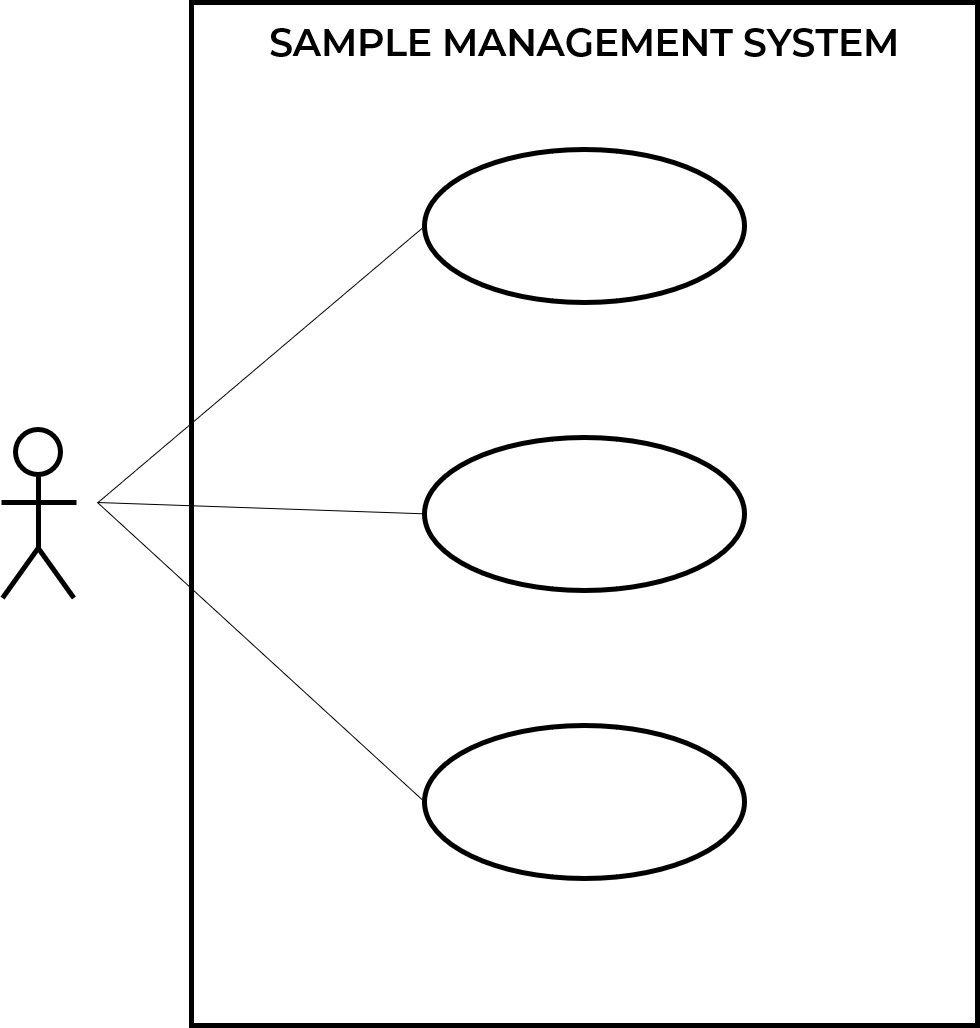
- Example of Use Case Diagram with Single User

This diagram represents a single General base Use Case. As you can see, the required form is based on user-related processes. The number of main processes varies by project. - Example of Use Case Diagram with Dual Users

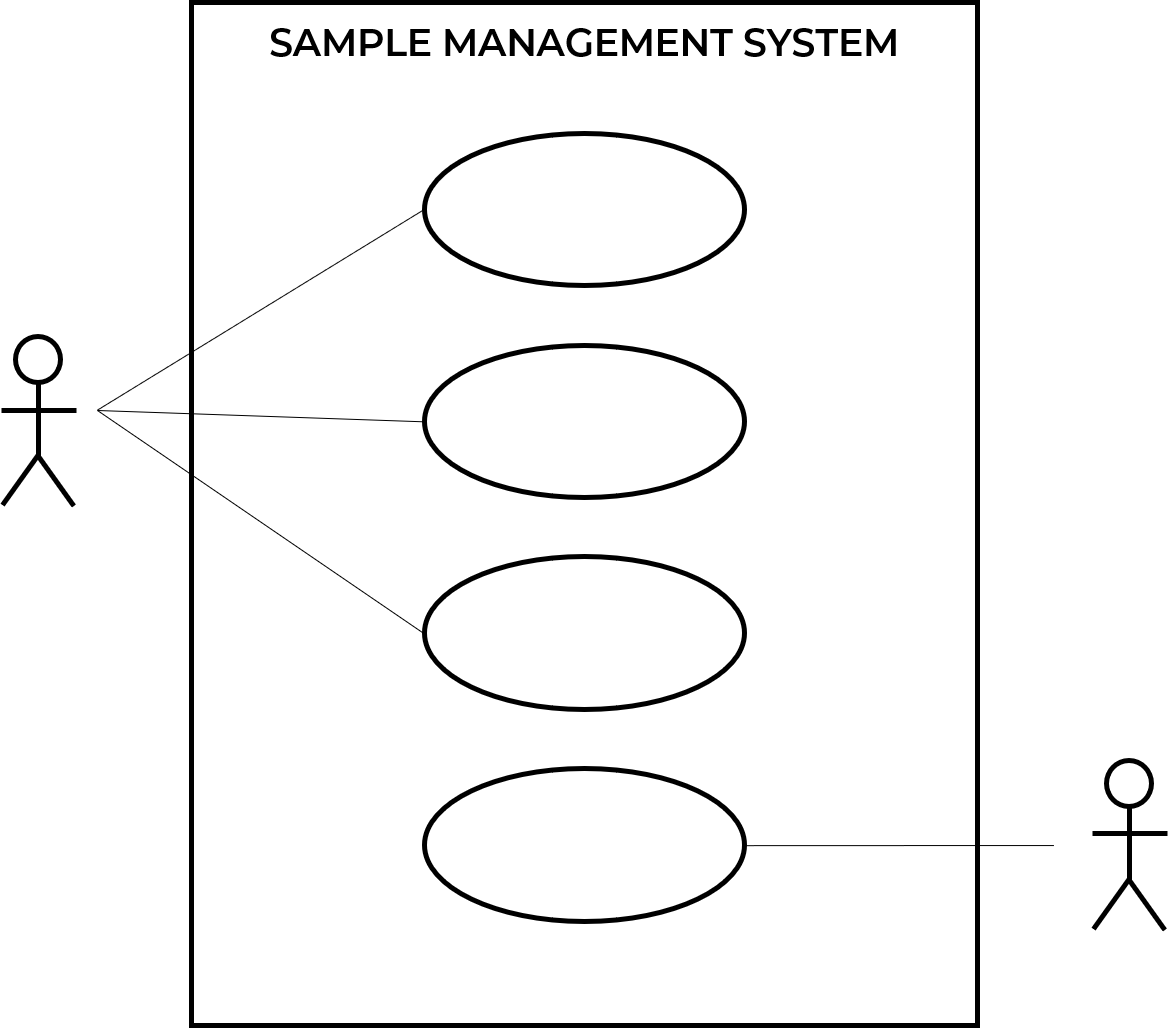
Here’s a dual-user UML Use Case sample. As you can see, certain processes are tied to one actor or user, but others are not. So, only a certain user can alter or use the processes. So he can’t use it.Example of the system that uses this USE CASE DIAGRAM are System that has client side and admin side system just like e-commerce websites and reservations management systems.
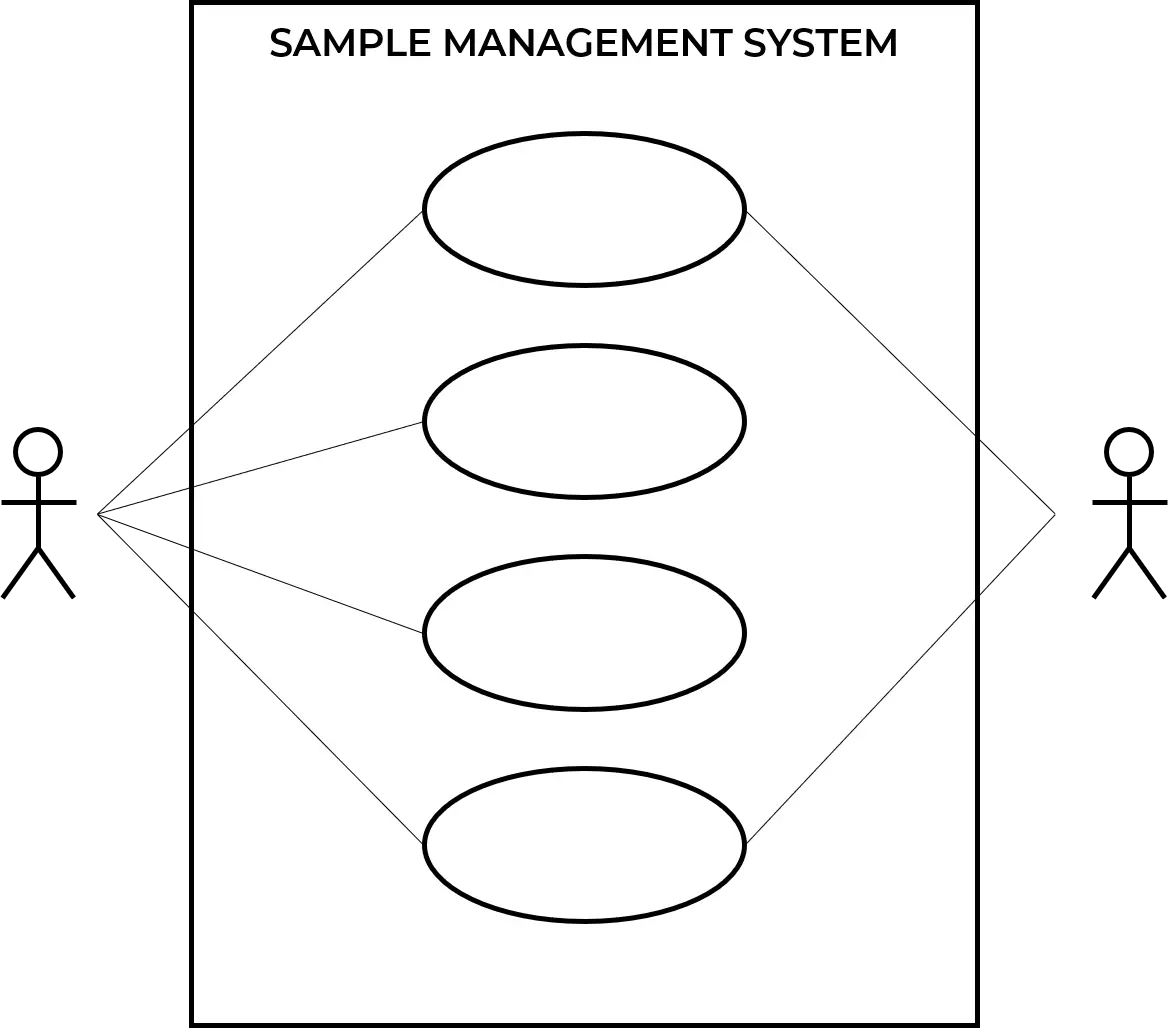
- Another Example of Use Case Diagram with Dual Users
Here’s another UML USE CASE with two linked users. This shows that both users can use the other processes. Log-in System, ATM System, and other systems requiring admin and client side security are appropriate examples.
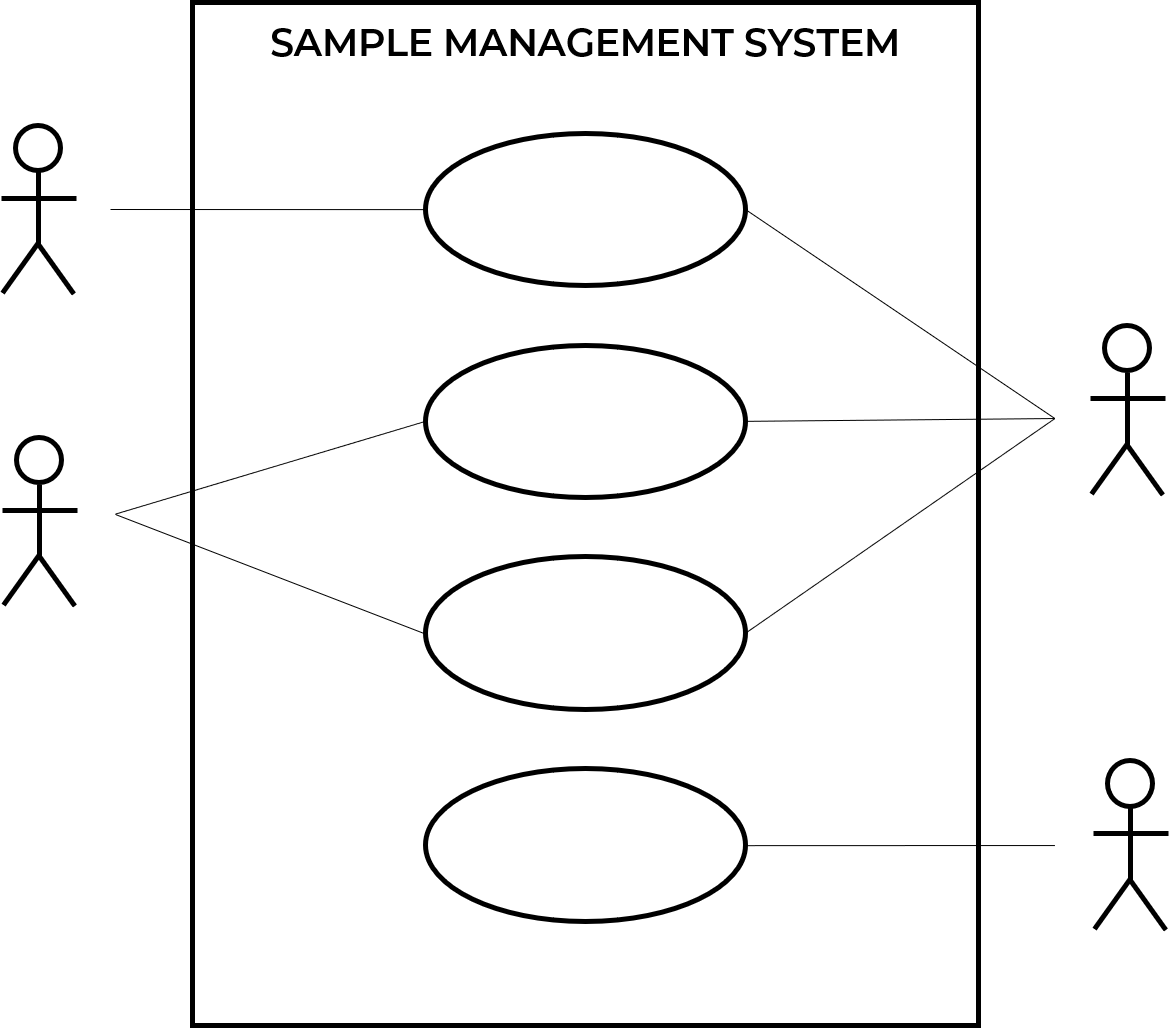
- Example of Use Case Diagram with Dual Users

Here’s your last 4 user General Use Case Diagram. Your ACTORS and use case can be as numerous as needed if they match your project’s users. It must suit system demands.
After creating general use cases, let’s construct specific ones. These are the UML Use Case Diagram sub processes for the generic use case. The sub processes’ “include>>” and “extend>>” arrows indicate if they’re needed or optional.
Example of Specific Use Case Diagrams:

Figure shows a Specific Use Case. Breaking down the primary process into its sub – processes determines its components or include use cases activities. Users and readers will know the system’s key functions and expected behaviors.
This time, I will give you an example of include and extending use case. It will be your guide you you create your own use case diagram for you project.
EXAMPLE of USE CASE DIAGRAM UML using EXTEND and INCLUDE
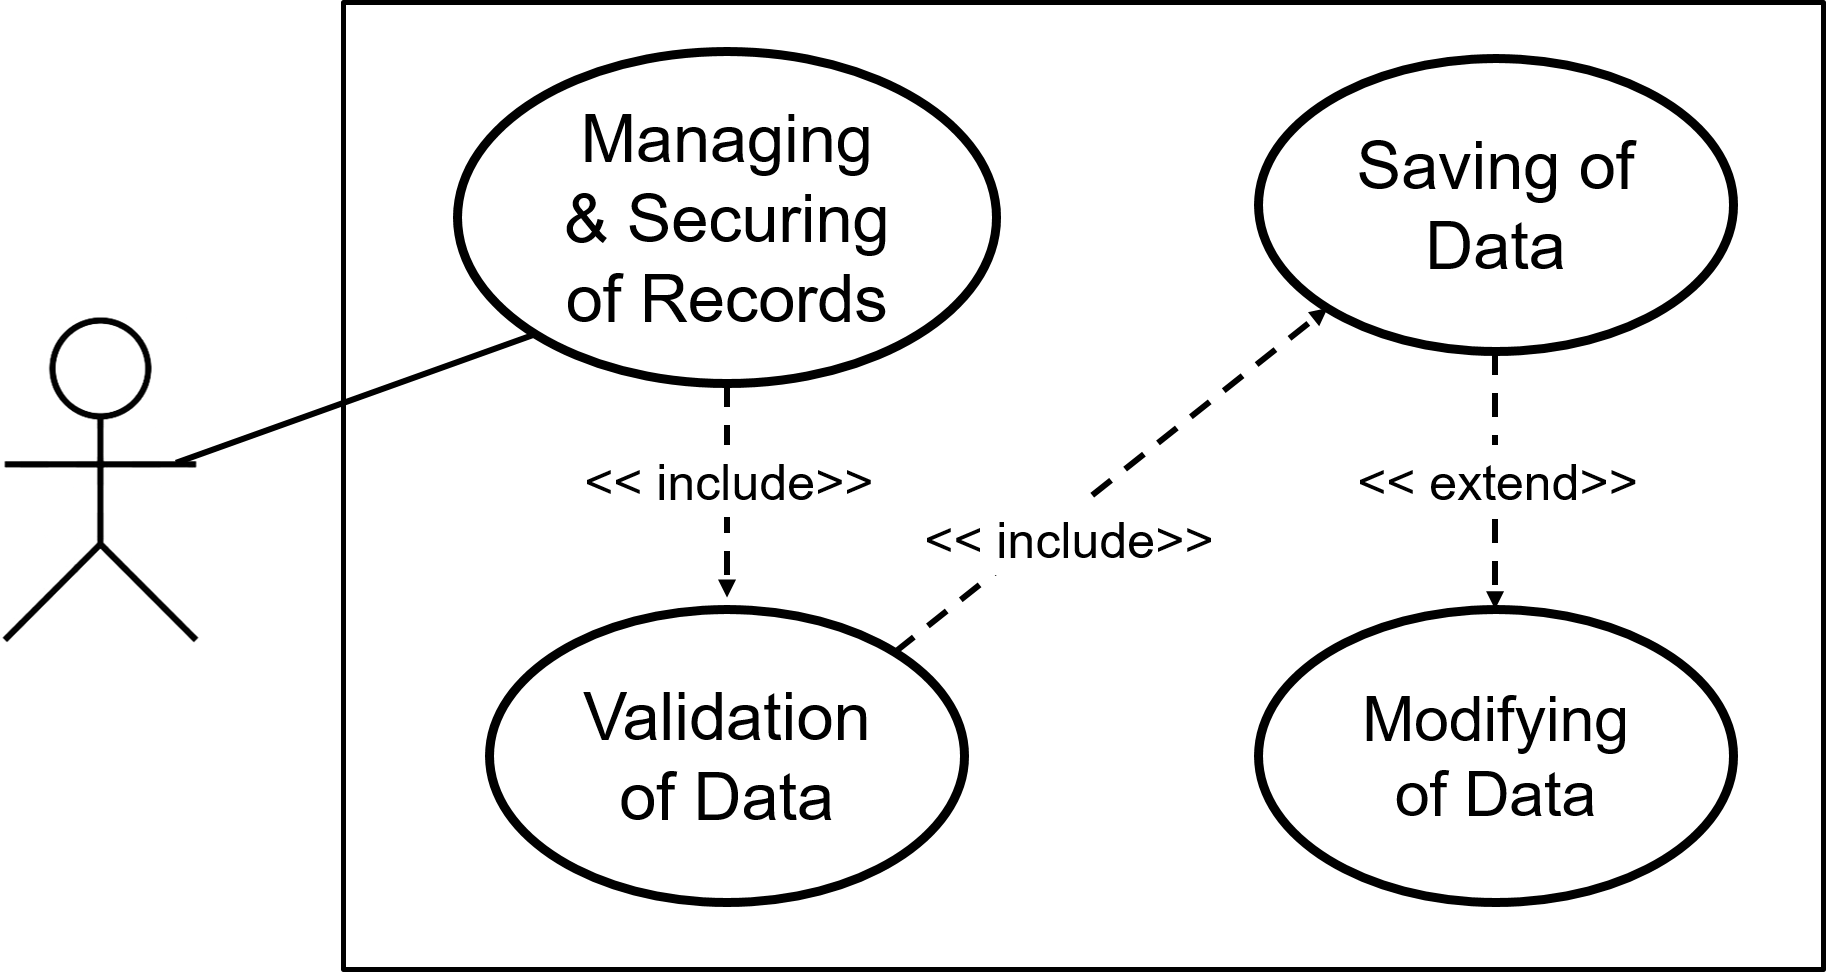
Our example for main process is the MANAGING and SECURING of RECORDS and its possible sub process were the validation of data, saving of data and modifying of data.
Conclusion
The reason why you should create the UML Use Case Diagram is not only to have a designed blueprint for the software, but also to understand fully the work and core functions of the proposed system. So you need to learn the meaning and understand the symbols through the given example of use case.
There is a list of examples below that you can download and use on your own. Just take a look.
- Use Case Diagram for Student Information System
- Use Case Diagram for Library Management System
- Login System Use Case Diagram | UML
Inquiries
Now, I have a question for you. what did you learn from the conversation? Do you know what you want to do for your project?
If you have thoughts or questions about our UML Use Case discussion, do not hesitate to comment it down. That will mean so much for me. Thank you so much and have a good day.
How to read a use case diagram
A use case diagram has 3 main elements: actors (stick figures outside the system), use cases (ovals inside the system boundary), and relationships between them.
- Actor. A role played by a human or external system that interacts with the system.
- Use case. A specific goal the actor accomplishes with the system.
- System boundary. The rectangle around the use cases marks what is inside vs outside.
- Association. Line between an actor and a use case they perform.
Use case relationships
- Include. Dashed arrow with include stereotype — one use case ALWAYS calls another (e.g., Login is included in Place Order).
- Extend. Dashed arrow with extend stereotype — an optional add-on to a base use case (e.g., Apply Discount extends Place Order).
- Generalization. Solid arrow with hollow triangle — one actor or use case is a specialized form of another.
Common capstone mistakes to avoid
- Too granular. Do not create a use case for each button. Focus on business goals.
- Missing actors. Every use case must be associated with at least one actor.
- Confusing include vs extend. Include is mandatory; Extend is optional.
- No system boundary. Missing rectangle is a common panel critique.
Where the use case diagram fits in Chapter 3
- Section 3.1 (System Overview) or 3.2 (Functional Requirements).
- List each use case with a brief description in a table alongside the diagram.
- Reference each use case when explaining the workflow in later sections.
Official documentation
Frequently asked questions
What is a use case diagram used for in BSIT capstone?
A use case diagram shows what the system does from the user’s perspective: actors, use cases, and their relationships (include, extend, generalization). It goes in Chapter 3 and communicates the functional requirements of the system.
What tool should I use to draw the use case diagram?
Free options: draw.io (browser-based, saves to Google Drive), Lucidchart free tier, PlantUML (text-based, version-controllable), StarUML (30-day trial then reduced feature set), Visual Paradigm Community Edition. Paid options: Microsoft Visio, Lucidchart pro, Enterprise Architect. For BSIT capstones, draw.io is the most commonly used free tool.
How detailed does the use case diagram need to be for capstone defense?
Panel members expect the diagram to match the actual system implementation. Include every major class/use case/entity relevant to the system. Omit trivial helper classes. Every diagram element should have a clear justification. Aim for 1-2 diagrams that fully cover the system, not many partial ones.
Should I use black-and-white or colored diagrams?
Black-and-white is standard for capstone documentation to match the thesis format. Use color only if it improves clarity (e.g., grouping subsystems). Ensure text is readable at printed size (10pt minimum for labels).
Where does this diagram go in the capstone documentation?
Chapter 3 (System Design and Methodology) typically holds all UML diagrams. Introduce each diagram with a 1-paragraph description explaining what it shows and how to read it. Reference specific elements in the surrounding text so panel members can follow the design rationale.

Mary Grace G. Patulada
Programmer & Technical Writer at PIES IT Solution
Mary Grace G. Patulada (pen name ‘Nym’) is a programmer and writer at PIES IT Solution with a BSIT background from Carlos Hilado Memorial State College, Binalbagan Campus. Authored 370+ UML diagram tutorials and capstone documentation guides at itsourcecode.com. Specializes in UML (class, use case, activity, sequence, component, deployment), DFD, and ER diagrams for BSIT capstone projects.
Expertise: UML Diagrams · DFD · ER Diagrams · Use Case Diagrams · Activity Diagrams · Capstone Documentation · PHP
· View all posts by Mary Grace G. Patulada →