
Using predetermined symbols, a DFD (Data Flow Diagram) for the POS system depicts its overall processes. The DFD’s defined symbols are composed of:
| Name | Symbol | Meaning |
| External Entities |  | The places where data comes into and goes out of the system are called “External Entities.” Entities are referred to by numerous names, including actors, terminators, sources, and links. |
| Process | 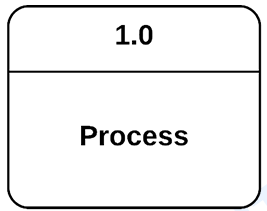 | The process is the part of DFD that is in charge of processing the data and producing output from it. |
| Data Store | A data store also called a database, is a table that stores files and other resources for potential future use. | |
| Data Flow | 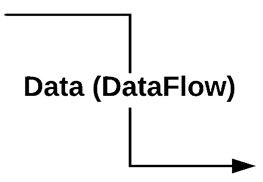 | Data flow is the transfer of information between different external organizations, processes, and data stores. |
Familiarizing these DFD components will smoothen the POS system data flow diagram discussion. Now let us know…
How DFD works?
The Data Flow Diagram (DFD) represents the flow of data and the transformations in the POS System. These transformations occur as data enters and exits a system.
In the DFD, input, processing, and output are used to represent and define the overall system. The following are the data that the System modifies:
- Sales Information
- Customers Information
- Revenue Information
- Payment Records
- Vat Tax and Discounts
- Receipts
These data (input/output) are also present in the POS System UML diagrams that build the whole system. It is because the system is not just about the data inputs and outputs but also the processes and backbone structures.
Therefore, to create a well-engineered Point of Sale System, programmers use standard diagrams to furnish the project.
What is a Point of Sale DFD?
The point-of-sale (POS) system is a software and hardware-based solution that estimates a business’s sales. A data flow diagram depict the system’s overall flow (DFD).
Furthermore, the POS DFD consists of three levels that broaden as the diagrams go deeper. Each of the levels sparks a concept that lets you understand the functions of the system.
First to discuss is the…
Point of Sale (POS) DFD Level 0
The system’s overall operation is compact in a single process on the context diagram (DFD level 0). This is to identify the POS system’s fundamental goal. See the context diagram’s demonstration below.

The point of sale system is highlighted in the example context diagram as the primary process.
The users (external entities) will give inputs to trigger the main function. Admin and customers were the system’s primary users and they will be the source of input.
As soon as the input is present, the data flow then begins. The context diagram for the POS system will be expanded upon in the diagrams that follow.
Point of Sale (POS) DFD Level 1
The “extended viewpoint” of the context diagram is DFD Level 1. It is beneficial to elaborate on the idea learned from the context diagram.
Level 1 specifically offers a more thorough understanding of the procedures involved in online shopping. This is done to make it clearer how data moves from the input to the output and how it changes along the way.

This level exposes the following sub-processes to elaborate on the concept from the context diagram:
- Manage Customer Information
- Manage Sales Information
- Manage Payment
- Generate Receipts
The sub-processes that are part of the main process are a big focus of DFD level 1. The DFD Level 2 is utilized when a specific sub-process needs to be discussed.
Point of Sale (POS) DFD Level 2
While levels 0 and 1 of the DFD largely focus on procedures, level 2 of the DFD places more emphasis on the project’s other components.
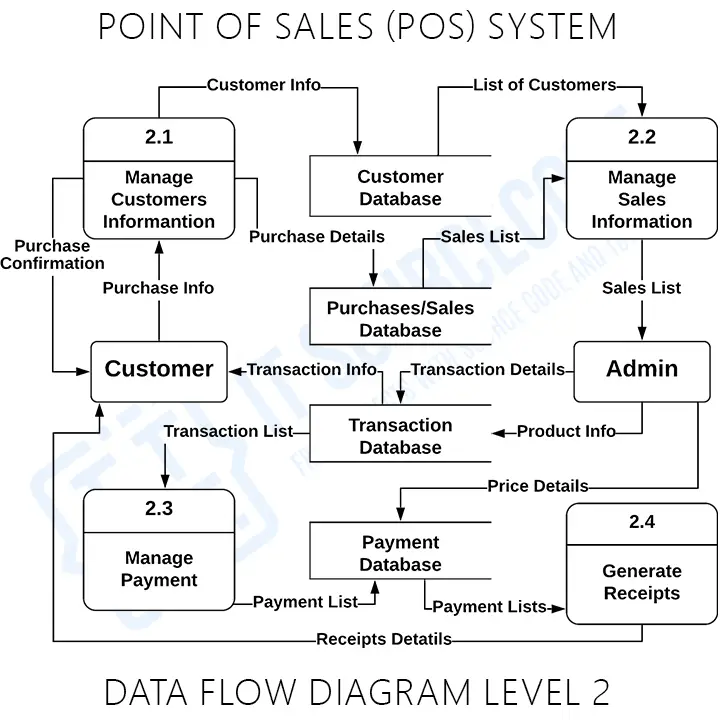
This level places more emphasis on the system’s databases (data stores). The POS’ data storages are as follows:
- Customer Databases
- Purchases or Sales Database
- Transaction Database
- Payment Database
Using the ER Diagram for the Point of Sale System, you can find out more about the databases of the system.
Reminder
Depending on the requirements of your project or the preferences of your client, the description of the DFD levels provided vary. The explanation is acceptable as long as it clarifies the primary goal, supporting processes, and database structures of the system.
The fundamental system process should be highlighted in the DFD level 0 (context diagram).
More details about the subprocesses of the primary process must be provided in the DFD level 1.
The DFD level 2 is the highest extraction for the project, making it the most comprehensive of the three diagrams. However, this level just identifies a DFD level 1 subsystem or subprocess. DFD level 2 can be represented by a lot of diagrams when every component of a project needs to be defined.
Conclusion
It has been discussed why a data flow diagram (DFD) should be drawn for levels 0, 1, and 2 of an online retail system.
Even though there is no order between the three levels, their jobs work together to finish the processes of the data flow diagram.
How to read a data flow diagram
A DFD shows how data moves through the system. Unlike UML, DFD is not part of the UML standard but is standard in structured analysis and BSIT capstone documentation.
- Process. Circle or rounded rectangle representing a transformation of data.
- Data store. Open-ended rectangle representing persistent storage.
- External entity. Rectangle outside the system representing a source or destination.
- Data flow. Arrow labeled with the data being moved.
DFD levels
- Level 0 (Context diagram). The entire system as a single process.
- Level 1. Explodes the context into 3-7 major sub-processes.
- Level 2. Further decomposes each Level 1 process.
- Level 3+. Rarely needed.
Common capstone mistakes
- Skipping Level 0. Always start with the context diagram.
- Process with no output. Every process must produce data.
- Data flow between two external entities. Data flows must involve at least one process.
- Unbalanced levels. Inputs and outputs at Level N must match Level N-1.
- Missing data store labels. Every data store needs a name.
Where the DFD fits
- Section 3.2 (System Analysis).
- Include all levels 0-2.
- Number each process (1.0, 1.1, etc.).
Official documentation

Mary Grace G. Patulada
Programmer & Technical Writer at PIES IT Solution
Mary Grace G. Patulada (pen name ‘Nym’) is a programmer and writer at PIES IT Solution with a BSIT background from Carlos Hilado Memorial State College, Binalbagan Campus. Authored 370+ UML diagram tutorials and capstone documentation guides at itsourcecode.com. Specializes in UML (class, use case, activity, sequence, component, deployment), DFD, and ER diagrams for BSIT capstone projects.
Expertise: UML Diagrams · DFD · ER Diagrams · Use Case Diagrams · Activity Diagrams · Capstone Documentation · PHP
· View all posts by Mary Grace G. Patulada →
Working source code for this system
Download the actual implementation of this system in your preferred language. Each project includes source code, database, and setup instructions for BSIT capstone use.
Frequently asked questions
What is a data flow diagram used for in BSIT capstone?
A data flow diagram shows how data moves through the system: processes, data stores, external entities, and data flows. Level 0 (context) shows the whole system as one process; Level 1 breaks it into major sub-processes; Level 2 details each sub-process.
What tool should I use to draw the data flow diagram?
Free options: draw.io (browser-based, saves to Google Drive), Lucidchart free tier, PlantUML (text-based, version-controllable), StarUML (30-day trial then reduced feature set), Visual Paradigm Community Edition. Paid options: Microsoft Visio, Lucidchart pro, Enterprise Architect. For BSIT capstones, draw.io is the most commonly used free tool.
How detailed does the data flow diagram need to be for capstone defense?
Panel members expect the diagram to match the actual system implementation. Include every major class/use case/entity relevant to the system. Omit trivial helper classes. Every diagram element should have a clear justification. Aim for 1-2 diagrams that fully cover the system, not many partial ones.
Should I use black-and-white or colored diagrams?
Black-and-white is standard for capstone documentation to match the thesis format. Use color only if it improves clarity (e.g., grouping subsystems). Ensure text is readable at printed size (10pt minimum for labels).
Where does this diagram go in the capstone documentation?
Chapter 3 (System Design and Methodology) typically holds all UML diagrams. Introduce each diagram with a 1-paragraph description explaining what it shows and how to read it. Reference specific elements in the surrounding text so panel members can follow the design rationale.