
If you are working on a capstone project for your BSIT course in 2026 and need a Data Flow Diagram (DFD) for Restaurant Management Systemthis guide gives you everything: the context diagram (Level 0), Level 1 and Level 2 DFDs, the entities involved, every data flow you should include, and how to defend it during your panel review.
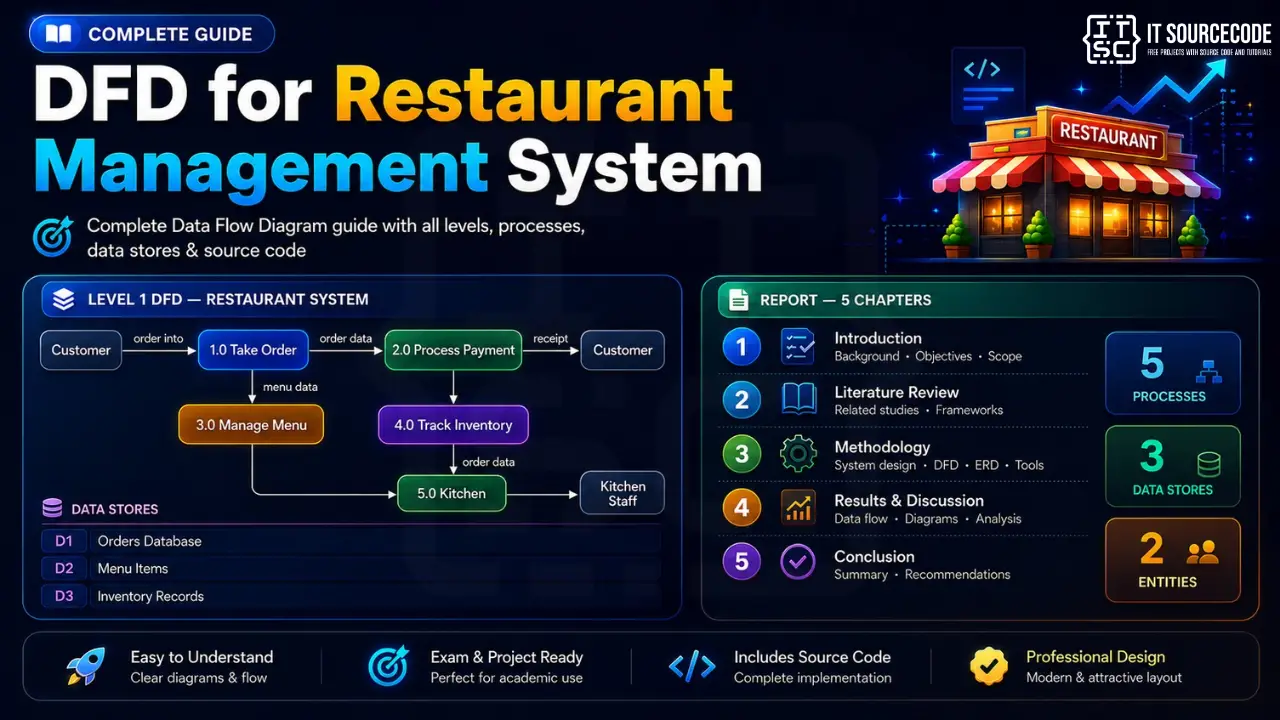
A DFD is the cleanest way to show how information moves between the customer, waiter, kitchen, cashier, and inventory of a restaurant. Most students draw a single confusing diagram and lose points. Have a layered DFD that examiners actually like to read.
What Is a DFD for Restaurant Management System?
A Data Flow Diagram for a Restaurant Management SystemIs a graphical representation of how data moves through the restaurant’s operations. It shows the entities(customer, waiter, manager, kitchen), the processes(take order, prepare food, generate bill), the data stores(menu, inventory, sales records), and the data flowsThat connect them.
Unlike a flowchart, a DFD does not show control flowit only shows data flow. That distinction matters during panel defense, because examiners will test whether you understand it.
Symbols You Will Use
- External Entitya square. Represents the source or destination of data outside the system (Customer, Supplier, Manager).
- Processa circle or rounded rectangle. Represents an action that transforms data (Process Order, Calculate Bill).
- Data Storean open rectangle. Represents stored data (Menu Database, Order History).
- Data Flowan arrow showing the direction in which data moves between elements.
Two notation styles exist: Yourdon & Coad(circles for processes) and Gane & Sarson(rounded rectangles). Use whichever your school standardizes on, but stay consistent within one diagram.
Free tool
Generate this Data Flow Diagram in 3 minutes
You have the structure. Now build it with your own entities. The Restaurant Management template comes pre-filled, so you rename what does not match your project and export straight into your Chapter 3.
Open the Restaurant Management template →3 free diagrams every week. No credit card needed.
Level 0 DFD (Context Diagram) for Restaurant Management System
The Level 0 DFDalso called the Context Diagramtreats the whole Restaurant Management System as a single process. It shows what enters the system and what leaves it. Keep it simple: examiners use this diagram to verify you understand the system’s boundaries.
External entities at Level 0
- Customerplaces orders, makes payments, receives food and receipts.
- Waiter/Staffenters orders into the system, receives kitchen tickets, processes payments.
- Managerreviews reports, updates the menu, manages stock and staff schedules.
- Supplierreceives purchase orders, sends inventory updates.
Data flows at Level 0
- Customer → System: order request, payment
- System → Customer: food, receipt, change
- Waiter → System: order entry, table assignment
- System → Waiter: kitchen ticket, bill
- Manager → System: menu updates, stock additions, schedule changes
- System → Manager: daily sales report, low-stock alert, staff hours
- Supplier → System: delivery confirmation, invoice
- System → Supplier: purchase order
Level 1 DFD for Restaurant Management System
The Level 1 DFDBreaks the single context process into its main sub-processes. For a restaurant management system, the Level 1 DFD typically contains 5–7 numbered processes plus the data stores they read from and write to.
Processes at Level 1
- 1.0 Manage Menuadd, edit, or remove menu items. Reads/writes the Menu data store.
- 2.0 Process Orderaccept customer orders from the waiter, route to kitchen. Reads Menu, writes Orders.
- 3.0 Prepare Foodkitchen receives the ticket, updates order status when ready. Reads Orders, writes Order Status.
- 4.0 Generate Billcalculates totals (including tax and tips), produces the customer’s receipt. Reads Orders, writes Sales.
- 5.0 Manage Inventorytracks stock levels, deducts ingredients per order, generates low-stock alerts. Reads/writes Inventory.
- 6.0 Generate Reportsdaily sales summaries, top-selling items, peak-hour analysis. Reads Sales, Orders, Inventory.
Data stores at Level 1
- D1, Menu: dish_id, name, category, price, available_yn
- D2, Orders: order_id, table_no, items[], status, total, created_at
- D3, Inventory: ingredient_id, name, unit, current_stock, reorder_level
- D4, Sales: sale_id, order_id, payment_method, total, timestamp
- D5, Staff: staff_id, name, role, shift, contact
Level 2 DFD: Drilling Into “Process Order”
Level 2 DFDsAre not required for every Level 1 process, only the ones complex enough to warrant a closer look. For a Restaurant Management System, Process 2.0 (Process Order)Is usually the one examiners ask about.
Sub-processes of “Process Order” (2.0)
- 2.1 Verify Menu Item Availabilitychecks the Menu data store before accepting an item.
- 2.2 Calculate Item Subtotalquantity × price.
- 2.3 Write Order to Databasepersists the order with status = “PENDING”.
- 2.4 Send Kitchen Ticketpushes the order detail to Process 3.0 (Prepare Food).
- 2.5 Update Inventory Reservationtemporarily decrements stock projections in Process 5.0 (Manage Inventory).
This level of detail is where most capstone reports either earn or lose points. Show that you thought about what happens if an item is out of stock mid-orderthat single edge case demonstrates real systems thinking.
Common DFD Mistakes Students Make
- Drawing control flow instead of data flow.Arrows should show data moving, not “if A then B” logic.
- Skipping the Level 0 diagram.Examiners expect a clean context diagram first. Without it, the Level 1 looks ungrounded.
- Mixing notation styles.Pick Yourdon & Coad orGane & Sarson. Don’t mix circles and rounded rectangles in the same diagram.
- Forgetting the data stores.Every process that “remembers” data needs a data store. A bill calculation that doesn’t write to a sales table is incomplete.
- Overcrowding Level 1.Keep it to 5–7 processes. More than that, push to a Level 2 DFD.
Recommended Tech Stack to Implement the DFD
If your capstone implementation follows the DFD, the most maintainable stack for a Restaurant Management System in 2026 is:
- Backend:PHP (Laravel or vanilla) or Python (Django / Flask)
- Database:MySQL, maps cleanly to the data stores listed above
- Frontend:Bootstrap-based admin (waiter screen) + simple customer-facing menu
- Optional:Print-server library to push kitchen tickets to a thermal printer
Free Resources for Your Restaurant Management Capstone
- ER Diagram for Restaurant Management Systemthe database design that pairs with this DFD
- Restaurant Management System Project in PHP with Source Code
- Use Case Diagram for Restaurant Management System
- Class Diagram for Restaurant Management System
- Activity Diagram for Restaurant Management System
Frequently Asked Questions
Official documentation
What is a DFD for Restaurant Management System?
A Data Flow Diagram for a Restaurant Management System is a visual representation showing how data flows between customers, waiters, the kitchen, the inventory, and the manager. It illustrates the input, processing, output, and storage of restaurant operations data, used as a core deliverable in BSIT capstone documentation.
How many levels of DFD does a Restaurant Management System need?
Three levels are standard for capstone documentation: Level 0(the context diagram showing the whole system as one process), Level 1(5–7 main sub-processes), and Level 2(a detailed breakdown of the most complex Level 1 process, usually “Process Order”).
What is the difference between a DFD and a flowchart for restaurant systems?
A DFD shows data flowwhat information moves between entities, processes, and storage. A flowchart shows control flowthe sequence of decisions and actions. Examiners often ask this question, so know it: a flowchart has decision diamonds; a DFD doesn’t.
Which processes belong in a Level 1 DFD for restaurants?
The standard Level 1 processes are: Manage Menu, Process Order, Prepare Food, Generate Bill, Manage Inventory, and Generate Reports. Keep the count between 5 and 7, fewer looks too shallow, more becomes unreadable and should be split into Level 2 diagrams.
What database tables map to the DFD data stores?
Five tables cover the typical Restaurant Management System: menu(dish_id, name, category, price), orders(order_id, table_no, status, total), inventory(ingredient_id, current_stock, reorder_level), sales(sale_id, payment_method, total, timestamp), and staff(staff_id, name, role, shift).
Related UML Diagrams
- ER Diagram for Restaurant Management System
- Use Case Diagram for Restaurant Management System
- Class Diagram for Restaurant Management System
- Activity Diagram for Restaurant Management System
- Sequence Diagram for Restaurant Management System
- DFD for Hotel Management System (related domain)
Working source code for this system
Download the actual implementation of this system in your preferred language. Each project includes source code, database, and setup instructions for BSIT capstone use.
- PHP: Restaurant Management System Project in CodeIgniter
- VB.NET: Restaurant Management System in VB.net with Source Code
- Java: Restaurant Management System In Java
- Python: Restaurant Management System in Django with Source Code
- Django: Restaurant Management System in Django with Source Code
- Laravel: Online Food Catering Services Management System Project in Laravel
Frequently asked questions
What is a data flow diagram used for in BSIT capstone?
A data flow diagram shows how data moves through the system: processes, data stores, external entities, and data flows. Level 0 (context) shows the whole system as one process; Level 1 breaks it into major sub-processes; Level 2 details each sub-process.
What tool should I use to draw the data flow diagram?
Free options: draw.io (browser-based, saves to Google Drive), Lucidchart free tier, PlantUML (text-based, version-controllable), StarUML (30-day trial then reduced feature set), Visual Paradigm Community Edition. Paid options: Microsoft Visio, Lucidchart pro, Enterprise Architect. For BSIT capstones, draw.io is the most commonly used free tool.
How detailed does the data flow diagram need to be for capstone defense?
Panel members expect the diagram to match the actual system implementation. Include every major class/use case/entity relevant to the system. Omit trivial helper classes. Every diagram element should have a clear justification. Aim for 1-2 diagrams that fully cover the system, not many partial ones.
Should I use black-and-white or colored diagrams?
Black-and-white is standard for capstone documentation to match the thesis format. Use color only if it improves clarity (e.g., grouping subsystems). Ensure text is readable at printed size (10pt minimum for labels).
Where does this diagram go in the capstone documentation?
Chapter 3 (System Design and Methodology) typically holds all UML diagrams. Introduce each diagram with a 1-paragraph description explaining what it shows and how to read it. Reference specific elements in the surrounding text so panel members can follow the design rationale.

Joken E. Villanueva
Founder & Lead Developer at PIES IT Solution
Founder of PIES Information Technology Solutions, a software company building production-grade applications for institutions across the Philippines. Over 8 years of hands-on full-stack development experience, currently leading the development of ClinicAI, an AI-powered clinic management platform.
Expertise: PHP · MySQL · JavaScript · AI Integration · SaaS Architecture · VB.NET · Database Design · Capstone Documentation · Java · View all posts by Joken E. Villanueva →