
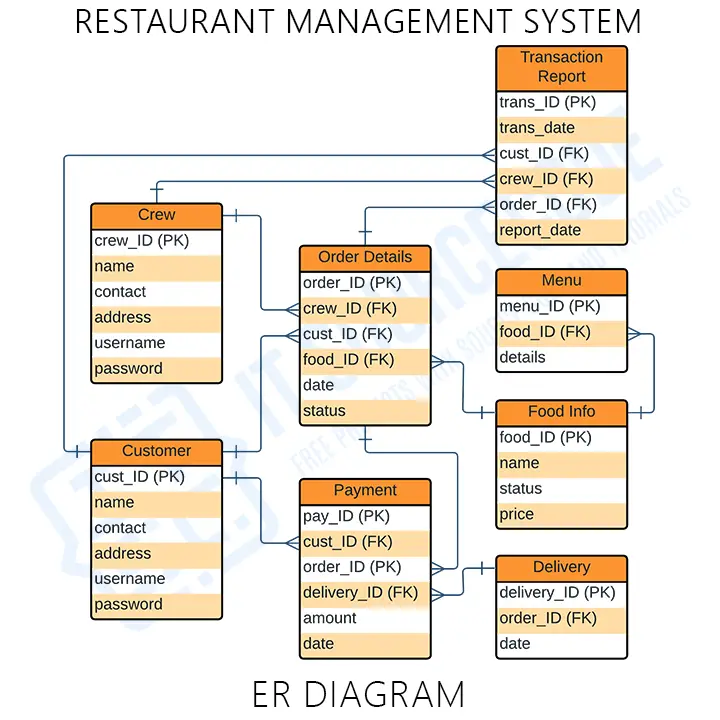
The model of the simple ER diagram for restaurant management system is shown in this ER (Entity Relationship) Diagram. The Restaurant Management System’s entity-relationship diagram shows all of the database tables. The connections between employees, sales, restaurants, orders, etc.
Moving on, it uses structured data and relationships between structured data groups to define how the Restaurant Management System works.
The Restaurant Management System is made up of six main parts: customer, crew, order details, payment, transaction report, menu, food info, and delivery.
Also, read the suggested articles below to learn more about ER Diagrams.
- ER Diagram for Online Ordering System
- Component Diagram for Restaurant Management System
- Restaurant Management System Sequence Diagram
- Activity Diagram for Restaurant Management System
- Chapter 3: Online Restaurant Management System project documentation
- Restaurant Management System Dataflow Diagram
Restaurant Management System ER Diagram: Details
The table shows the name and details of the Restaurant Management System ER Diagram. It has a complete description of the project’s information.
| Name: | Restaurant Management System ER Diagram |
| Abstract: | The Restaurant Management System ER Diagram shows how different things relate to each other. You can think of it as a plan for how your system (or project) will be put together. |
| Diagram: | ER Diagram is also known as Entity Relationship Diagram |
| Users: | School Librarian, Student (Book Borrowers), and School Admin |
| Tools Used: | Diagraming tools that provide ER diagram symbols. |
| Designer: | ITSourceCode.com |
What is a Restaurant Management System?
Restaurant management software aims to simplify some of the most common management duties in the restaurant industry. For example, it can combine information from several online booking channels so you can see all reservations and avoid double bookings.
What are the five major components of ER diagram?
Symbols and Notations for an Entity Relationship Diagram (ERD). An ER Diagram is made up of three main parts: an entity, an attribute, and a relationship. There are more parts that build off of the main parts. They are called weak entities, multi-valued attributes, derived attributes, weak relationships, and recursive relationships.
Why is ER diagram used?
ER diagrams exhibit relational database technology, logic, and business rules (in a logical data model or in a physical data model).
Restaurant Management System ER Diagram
The ER Diagram of the Restaurant Management System shows the system entity and the supposed functions in each relationship. It is the supposed database design of the project. This conveys the data that would be present in the restaurant system, its characteristics, and its connection with other data (entity).
ER Diagram Restaurant Management System with Tables
These tables below provide the complete database table details such as Field Name, Descriptions, data types, and character lengths.
Table Name: Customer
| Field | Description | Type | Length |
| cust_ID (PK) | Customer ID | Int | 11 |
| name | Customer Name | Varchar | 255 |
| contact | Customer Contact | Int | 11 |
| address | Customer Address | Text | |
| username | Customer Username | Varchar | 255 |
| password | Customer Password | Varchar | 255 |
Table Name: Crew
| Field | Description | Type | Length |
| crew_ID (PK) | Crew ID | Int | 11 |
| name | Crew Name | Varchar | 255 |
| contact | Crew Contact | Int | 11 |
| address | Customer Address | Text | |
| username | Crew Username | Varchar | 255 |
| password | Crew Password | Varchar | 255 |
Table Name: Order Details
| Field | Description | Type | Length |
| order_ID (PK) | User ID | Int | 11 |
| crew_ID (FK) | Crew ID | Int | 11 |
| cust_ID (FK) | Customer ID | Int | 11 |
| food_ID (FK) | Food ID | Int | 11 |
| date | Order Date | Date | 11 |
| status | Order Status | Varchar | 255 |
Table Name: Payment
| Field | Description | Type | 11 |
| pay_(PK) | Payment ID | Int | 11 |
| cust_ID (FK) | Customer ID | Int | 11 |
| order_ID (FK) | Order ID | Int | 11 |
| delivery_ID (FK) | Delivery ID | Int | 11 |
| amount | Amount | Int | 11 |
| date | Payment Date | Date |
Table Name: Menu
| Field | Description | Type | Length |
| menu_ID(PK) | Menu ID | Int | 11 |
| food_ID (FK) | Food ID | Int | 11 |
| details | Menu Details | Varchar | 255 |
Table Name: Food
| Field | Description | Type | Length |
| food_ID (PK) | Food ID | Int | 11 |
| name | Food Name | Varchar | 30 |
| status | Food Status | Int | 11 |
| price | Food Price | Int | 11 |
Table Name: Delivery
| Field | Description | Type | Length |
| delivery_ID (PK) | Delivery ID | Int | 11 |
| order_ID (FK) | Order ID | Int | 11 |
| date | Delivery Date | Date |
Table Name: Transaction
| Feild | Description | Type | Length |
| trans_ID (PK) | Transaction ID | Int | 11 |
| trans_date | Transaction Date | Date | |
| cust_ID | Customer ID | Int | 11 |
| crew_ID (FK) | Crew ID | Int | 11 |
| order_ID (FK) | Order ID | ||
| report_date | IntD11ate of Report | Date |
ER Diagram for Restaurant Management System PDF
The ER Diagram for Restaurant Management System PDF provides information explaining the concepts of the project database. You may apply this information to your capstone project. You can also use it as is or change its content to fit the needs of your project.
Click to Download the PDF File below.
How to create ER Diagram in Restaurant Management System
Time needed: 5 minutes
Here are the steps on how to create Restaurant Management System ER Diagram
- Step 1: Become acquainted with the ER Diagram (Entity Relationship Diagram)
The Entity Relationship Diagram shows the structure of data types in a project. It uses symbols to clarify its parts and relationships. Their symbols and applications must be familiar before you build the ER Diagram.
ER Diagram Symbols:
Fields are the parts of a table that define the entity’s characteristics. In the database that the ERD models, attributes are commonly thought of as rows.
Keys are a technique to categorize data quality. It is used to organize ER diagrams and assist users in modeling their databases to ensure that they are efficient. This is also used to connect different tables in a database.
A primary key identifies a single entity instance, which means a unique attribute or set of attributes.
A foreign key is produced when data attributes have one too many relationships with other entities. - Step 2: Complete the entities that will be included.
Begin designing your ER Diagram by finalizing your railway reservation system’s entities. These are rectangles. You must leave room in future phases so they can be incorporated.
- Step 3: Add the attributes of each entity
Upon finalizing the entities, analyze their attributes. As characteristics, ER diagram entities are described. All these are characteristics. Multivalued characteristics have several values.
- Step 4: Describe the relationships (cardinality) between entities and attributes
Entities, characteristics, and relationships are needed to draw ERD relationships. The data structure and entity relationship diagram are based on evaluated information.
Conclusion:
You need to know the diagrams used to design and develop the restaurant management system. That is to help you create a fully functional system with the use of the ER Diagram. Creating it will help you perceive the back end of the software. This will hold all the data that’ll enter and exit the system.
Inquiries
If you have any inquiries or suggestions about the ER Diagram for Restaurant Management System, just leave us your comments below. We would be glad to know your concerns and suggestions and be part of your learning.
Keep us updated and Good day!
Official documentation

Mary Grace G. Patulada
Programmer & Technical Writer at PIES IT Solution
Mary Grace G. Patulada (pen name ‘Nym’) is a programmer and writer at PIES IT Solution with a BSIT background from Carlos Hilado Memorial State College, Binalbagan Campus. Authored 370+ UML diagram tutorials and capstone documentation guides at itsourcecode.com. Specializes in UML (class, use case, activity, sequence, component, deployment), DFD, and ER diagrams for BSIT capstone projects.
Expertise: UML Diagrams · DFD · ER Diagrams · Use Case Diagrams · Activity Diagrams · Capstone Documentation · PHP · View all posts by Mary Grace G. Patulada →
Working source code for this system
Download the actual implementation of this system in your preferred language. Each project includes source code, database, and setup instructions for BSIT capstone use.
- PHP: Restaurant Management System Project in CodeIgniter
- VB.NET: Restaurant Management System in VB.net with Source Code
- Java: Restaurant Management System In Java
- Python: Restaurant Management System in Django with Source Code
- Django: Restaurant Management System in Django with Source Code
- Laravel: Online Food Catering Services Management System Project in Laravel
Frequently asked questions
What is a ER diagram used for in BSIT capstone?
An ER diagram shows the database schema: entities (tables), attributes (columns), and relationships (foreign keys, cardinality). It goes in Chapter 3 alongside the class diagram to communicate the data storage design.
What tool should I use to draw the ER diagram?
Free options: draw.io (browser-based, saves to Google Drive), Lucidchart free tier, PlantUML (text-based, version-controllable), StarUML (30-day trial then reduced feature set), Visual Paradigm Community Edition. Paid options: Microsoft Visio, Lucidchart pro, Enterprise Architect. For BSIT capstones, draw.io is the most commonly used free tool.
How detailed does the ER diagram need to be for capstone defense?
Panel members expect the diagram to match the actual system implementation. Include every major class/use case/entity relevant to the system. Omit trivial helper classes. Every diagram element should have a clear justification. Aim for 1-2 diagrams that fully cover the system, not many partial ones.
Should I use black-and-white or colored diagrams?
Black-and-white is standard for capstone documentation to match the thesis format. Use color only if it improves clarity (e.g., grouping subsystems). Ensure text is readable at printed size (10pt minimum for labels).
Where does this diagram go in the capstone documentation?
Chapter 3 (System Design and Methodology) typically holds all UML diagrams. Introduce each diagram with a 1-paragraph description explaining what it shows and how to read it. Reference specific elements in the surrounding text so panel members can follow the design rationale.