
Activity Diagram for Course Registration System
The UML activity diagram for course registration system is a diagram that presents the flow of system activities. It is one of the methods used to document the system behavior in terms of activities and development.
Additionally, the activity diagram uses symbols to define the overall workflow of the course registration system. It is composed of activities, decisions, and paths (flows).
Course Registration System Activity Diagram: Details
The table shows the project details of the activity diagram for course registration system. It has the complete details of the project.
| Name: | Course Registration System Activity Diagram |
| Abstract: | The course registration system Activity Diagram represents the behavior of the project in terms of its activities. It contains the important details on the activities and constraints done in the project. |
| UML Diagram: | Activity Diagram |
| Users: | School Admin, Authorized Registrar Personnel, and Students or Registrees. |
| Tools Used: | Diagram tools that provide activity diagram symbols. |
| Designer: | ITSourceCode.com |
What is Course Registration System?
A course registration system allows students to be registered in the course of their choice. When compared to manual course registration, the online registration form is easy to use and quick to fill out. As a result, it saves time and money.
Further, the course registration system helps students find out what they need to know about a course and sign up for it. This course registration method eliminates the need to physically fill out paper forms and mail them to a registration office. With this method, the student can sign up whenever they want and submit their information quickly online.
Define Course Registration System Activity Diagram
UML defines a course registration system activity diagram as a very effective behavior diagram. This diagram shows the flow of interaction between the system and clients. This is done by helping them visualize the system’s functionality in various degrees of detail.
The activity diagram in UML visually depicts a set of actions or control flows of a course registration system. It describes the processes in a use case diagram. Its’ illustration can also be sequential or concurrent.
Additionally, the activity diagram can clarify difficult use cases (use case diagram) to simplify and improve any process. It models the system’s actions, functions, and processes.
Importance of UML Activity Diagram
The use of an activity diagram involves major activities that define the workflow of the project. These activities flow with user decisions that result in more effective interaction. It also visualizes a set of actions or control flows of a course registration system.
An activity diagram in UML represents the Course Registration System‘s major activities and constraints. Then these activities generate a flow that the project should include. Each activity was labeled properly to determine the system’s behavior.
The activity diagram is one of the Course Registration System UML diagrams. It also shows the system’s dynamic behavior. It shows the flow of messages from one activity to another.
Activity Diagram: Benefits
The Activity Diagram Benefits are as follows:
- An Activity Diagram helps in understanding how an algorithm works.
- It also describes the steps that a UML use case takes.
- Shows how users and the system interact in a process or workflow.
- Clarify difficult use cases to simplify and improve any process.
Course Registration System Activity Diagram
The Course Registration System Activity Diagram example expounds on the system’s ideas. This activity diagram example using swimlanes is shown in the detailed illustration to enlighten the programmers.
It figures out the activities that happen when a user logs in to a system. This example illustration shows the activities and scenarios done in online booking. Thus, the actions and decisions included were all emphasized here.
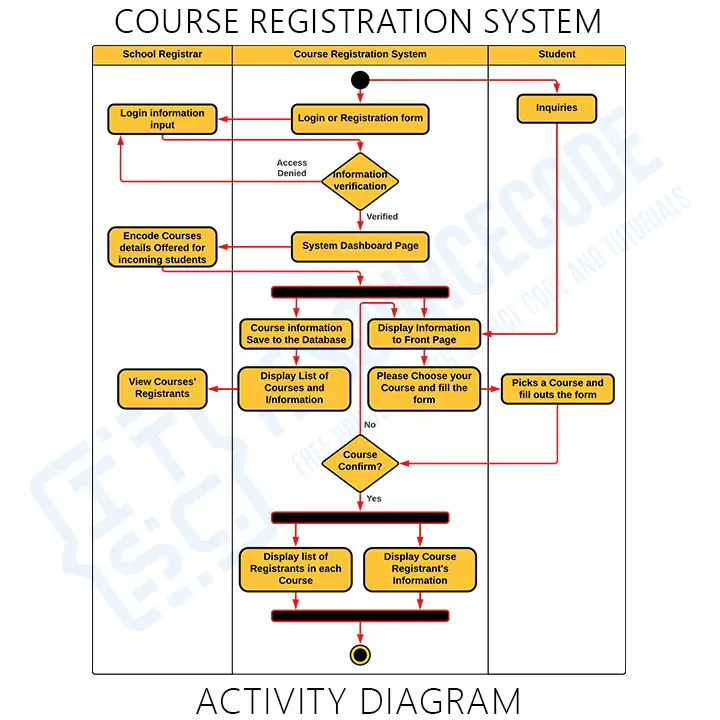
As seen in the illustration, we used the swimlane with three partitions. The left portion shows the school registrar’s lane. It covers all the possible activities of the registrar when using the system. Its container also symbolizes the scope of the personnel’s control.
The right partition is used as the student’s lane. This lane shows the students’ scope and activities.
Now, the system’s scope and activities were placed in the middle. This is to show that the system acts as the middleman between the registrar and the student. Therefore, the system is designed to be accessible by the student and the registrar.
To access the system, the users must have their accounts logged into the software. The functions were then emphasized as the activities flow and the system and users communicate.
You can add more to this and it is up to you how will you create your activity diagram. But, make sure that you have precise information and include the important decisions (actions).
Activity Diagram for Course Registration System Pdf
You may download the Activity Diagram PDF by clicking the button below. It has the full details and discussion on System’s Activity Diagram. You can also modify its content to complete your project requirements and needs.
What are the Symbols used in Activity Diagram?
Activity Diagram Symbols – are used not just to draw an activity diagram, but also to emphasize the role of all that was included in the system’s process. Each of the symbols was used to present a certain part of the system.
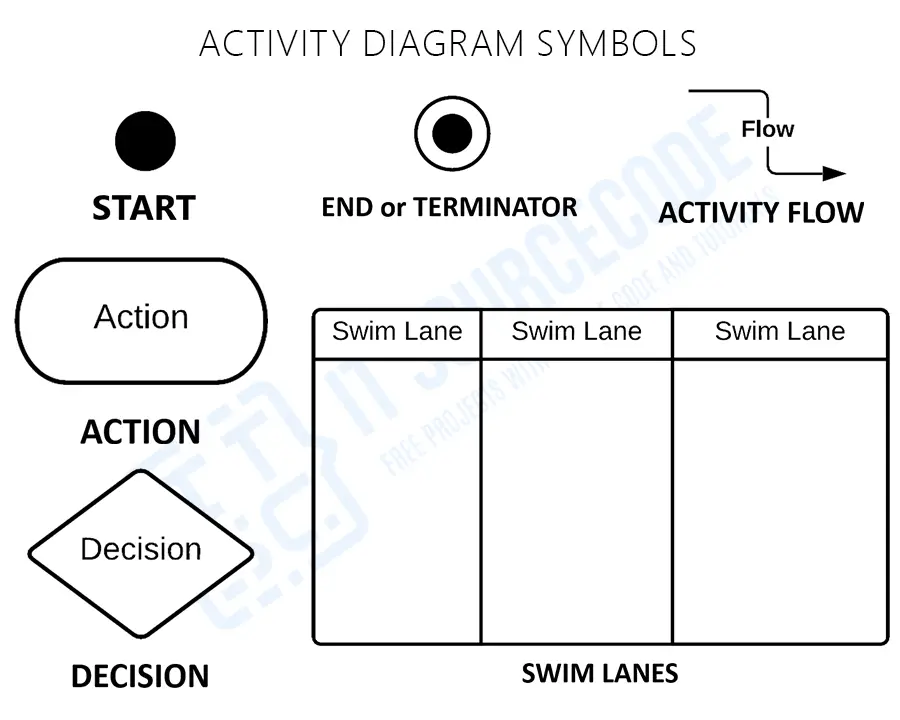
- Start – is the beginning of the action. It uses a filled circle symbol to show its function.
- Action – is a stage of an activity in which users or software accomplish a certain task. Action is shown in Round-edged rectangles.
- Decision – symbolizes a conditional branch in the flow. It has two or more outputs and a single input. A diamond symbol presents this notation.
- Swim Lanes – are the lanes showing the actor’s boundaries. The activities drew in the same lane considered as the organization’s activities. Swim lanes must be in a logical arrangement.
- Activity Flow – is another name for the connectors in the diagram that illustrate the flow between processes (activity).
- End (Terminator) – is the last phase of the activity. An indicated black circle represents the final node.
Each of these activity diagram symbols shows the overall system behavior. Emphasizing the system’s behavior would also be much easier by using these Activity Diagram symbols.
How to Draw an Activity Diagram?
Time needed: 5 minutes
Here are the steps in developing (designing) the activity diagram for course registration system.
- Step 1: Familiarize Activity Diagram Symbols
To draw an activity diagram, you need to familiarize yourself first with the symbols used. The symbols let you discuss the system’s flow of activities and interaction. Programmers can also quickly deliver the system’s concept to the users.
- Step 2: Identify the flow of actions.
After familiarizing the symbols used, you will need to identify the flow of actions. The flow of actions would be based on your use case diagram.
Actions describe the sequence or series of activities when a user invokes the course registration system. Moreover, the action represents a discrete unit of functionality in an activity diagram. It also describes the steps in a UML use case diagram.
The incoming and outgoing activity edges of actions specify the control flow of data. Its actions begin when all of the input requirements are met. - Step 3: Add the Actors (users) involved.
Actors carry out their actions on things, transforming them into other objects or changing their state. This actor is someone or something that interacts with the system from outside the system.
We use “actors” as labels on the swimlanes to indicate that the action or step performed was from them or the system. This way will help readers and developers how will the system behave or interact with actors or vice versa. - Step 4: Trace the flow of activities.
To trace the flow of activities, make sure that you know that flows can be sequential, branching, or run.
Developers use action or control flows to know the transition from one state of activity to another. There might be several entering and outgoing action flows in this notation.
Furthermore, control flow determines the activity’s flow, and the inbound arrow initiates a single activity step. Upon accomplishing this phase, the flow continues along the outgoing arrow. Object flow also describes the flow of objects (data) within activities.
Conclusion:
In conclusion, we have discussed What is an Activity Diagram for Course Registration System and the steps on how to develop it. This activity diagram acts as one of the methodologies for creating a course registration system.
Additionally, an activity diagram stresses the system’s flow of activities and the interactions between the users and the system.
Therefore, using an activity diagram in UML will not only let you understand the project but also tell you the possibilities while designing it. This diagram works best with the other UML Diagrams which are provided in the Recommended Articles. See also other Activity Diagrams in the Related Articles below.
Related Articles:
- Activity Diagram for Student Enrollment System
- Car Rental System Activity Diagram
- Activity Diagram for Face Recognition System
- University Management System Activity Diagram
- E-Commerce Website Activity Diagram
Recommended Articles from the Author:
- Course Registration System ER Diagram
- Sequence Diagram for Course Registration System
- Use Case Diagram for Course Registration System
- Component Diagram for Course Registration System
- Student Course Registration System Class Diagram
Inquiries
If you have inquiries or suggestions about Activity Diagram for Course Registration System, just leave us your comments below. We would be glad to hear to concerns and suggestions and be part of your learning.
Keep us updated and Good day!
Official documentation
Working source code for this system
Download the actual implementation of this system in your preferred language. Each project includes source code, database, and setup instructions for BSIT capstone use.
Frequently asked questions
What is a activity diagram used for in BSIT capstone?
An activity diagram shows the workflow or business logic: activities, decisions, forks, and joins in a process. It communicates the sequence of steps for a specific operation and is placed in Chapter 3.
What tool should I use to draw the activity diagram?
Free options: draw.io (browser-based, saves to Google Drive), Lucidchart free tier, PlantUML (text-based, version-controllable), StarUML (30-day trial then reduced feature set), Visual Paradigm Community Edition. Paid options: Microsoft Visio, Lucidchart pro, Enterprise Architect. For BSIT capstones, draw.io is the most commonly used free tool.
How detailed does the activity diagram need to be for capstone defense?
Panel members expect the diagram to match the actual system implementation. Include every major class/use case/entity relevant to the system. Omit trivial helper classes. Every diagram element should have a clear justification. Aim for 1-2 diagrams that fully cover the system, not many partial ones.
Should I use black-and-white or colored diagrams?
Black-and-white is standard for capstone documentation to match the thesis format. Use color only if it improves clarity (e.g., grouping subsystems). Ensure text is readable at printed size (10pt minimum for labels).
Where does this diagram go in the capstone documentation?
Chapter 3 (System Design and Methodology) typically holds all UML diagrams. Introduce each diagram with a 1-paragraph description explaining what it shows and how to read it. Reference specific elements in the surrounding text so panel members can follow the design rationale.

Mary Grace G. Patulada
Programmer & Technical Writer at PIES IT Solution
Mary Grace G. Patulada (pen name ‘Nym’) is a programmer and writer at PIES IT Solution with a BSIT background from Carlos Hilado Memorial State College, Binalbagan Campus. Authored 370+ UML diagram tutorials and capstone documentation guides at itsourcecode.com. Specializes in UML (class, use case, activity, sequence, component, deployment), DFD, and ER diagrams for BSIT capstone projects.
Expertise: UML Diagrams · DFD · ER Diagrams · Use Case Diagrams · Activity Diagrams · Capstone Documentation · PHP · View all posts by Mary Grace G. Patulada →