
What is a pivot table?
A pivot table is one of the features in Excel that allows you to arrange data in various ways with just a few clicks.
It automatically analyzes, summarizes, sorts, and filters a huge amount of data and stores it in a single table.
In addition to that, this table has columns, rows, and data fields that can be moved and changed to help the user expand, isolate, sum, and group particular data in real-time.
This table calculates the sum and average of the data and presents the results in a reasonable manner.
It has built-in percentage calculations available so that users can easily get the difference and compare data from different perspectives.
What Is a Pivot Table Used For?
Pivot tables were used for a variety of purposes including the following:
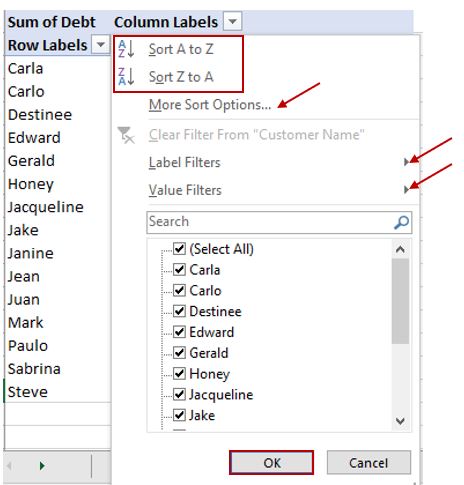
1. Filtering Data
A pivot table allows you to filter data by different criteria, such as names, dates, values, or categories.
It makes your work much easier and allows you to focus on specific aspects of the data. You can also analyze them in greater detail.
2. Summarizing Data
Pivot tables help to summarize large amounts of data in many user-friendly ways by creating a concise and compact set of reports.
You can use a pivot table to quickly analyze huge amounts of data, and you’ll get an overview of the information.
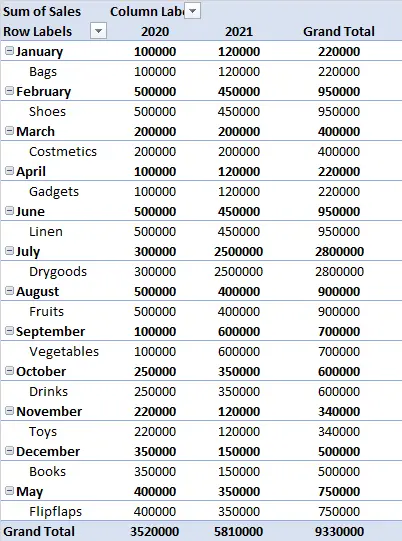
Another example you’ll see:
- group of months and a list of products sold each year.
- Count the total amount of sales in each month and year.
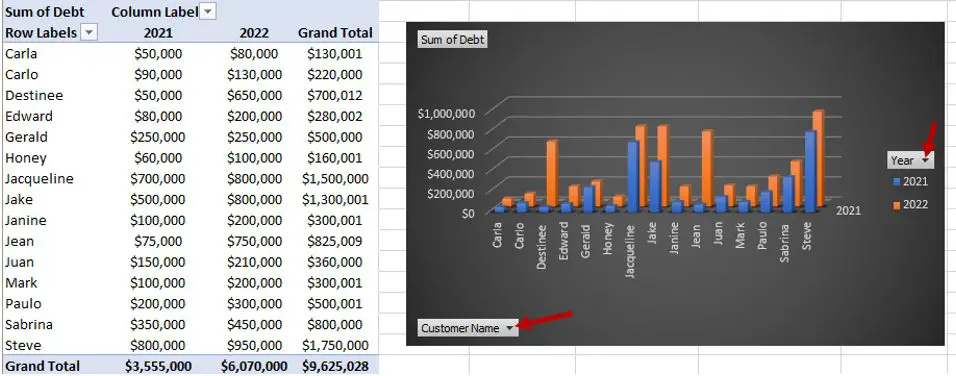
3. Visualizing Data
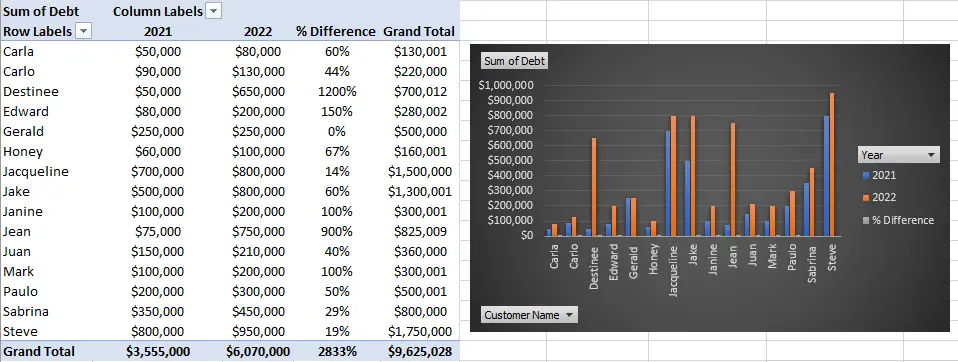
A pivot table helps you create charts and graphs that interpret your data visually.
This makes it easier to understand the data and identify trends and patterns.
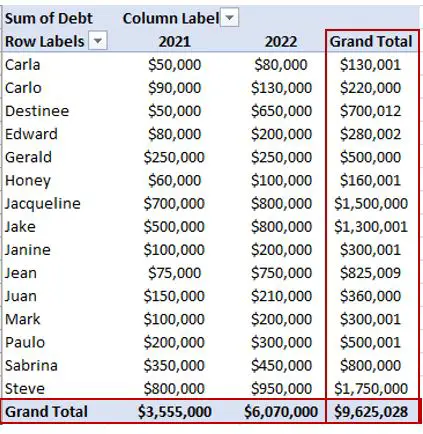
4. Comparing Data
A pivot table enables you to compare and calculate data by creating another column and getting the comparisons of the data.
You can use these tables to compare different aspects of your data, such as debt by years customer, and more.
It just depends on your data and what data you want to compare or get the difference from.
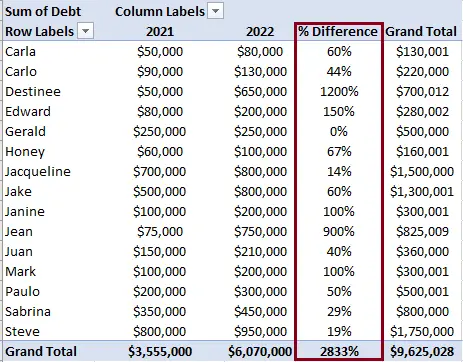
In our example above, we are comparing the total debt of 2021 to 2022, and this table gives the result of the percent difference.
5. Finding Patterns
Pivot tables allow you to identify patterns and trends in your data by creating summaries and visualizations.
You can use these tables to spot trends, outliers, and anomalies that may be hidden in the data.
As you can see in the image above, pivot tables enable data analysts to summarize huge and different sets of data into meaningful and concise tables that can be understood easily.
Benefits of Using Pivot Tables in Excel
This time, we already know what a pivot table is and how to use it. Now let’s move on to the benefits of using this table.
Easy to analyze and summarize data
It allows you to analyze a lot of data or information right away. Using a pivot table makes it easy for you to analyze and summarize data.
This table makes a huge amount of data manageable and easy to analyze.
With just a few clicks, this table will show you what you want to analyze. The results are straightforward and easy to understand.
Usually, when you have a lot of data in your Excel spreadsheet, it is hard to find the specific data that you need.
However, using this table allows you to summarize the data in a quick and easy way. You can arrange your data depending on your needs.
You just have to put the right data in the right row, column, and values.
User-friendly and Simple
- The advantage of using this table is that it is easy to use and understand, literally, and it is user-friendly, so it won’t be hard for you to use it. You can analyze and summarize your data by checking the data in the pivot table field or just dragging the data in the drag fields. You can also move the data to another section of the table.
- It is accurate to get percentage differences between other data; aside from that, reporting is much easier to do in this table, and certainly, it is more efficient. It can totally save you time compared to doing it manually and using some formulas.
Pivot Table Functions
This time we will give some brief information with regard to the functions of a pivot table.
Let’s know what the functions of a pivot table are. The following results were just the same as if you were using a formula in an Excel worksheet.
Sum Function
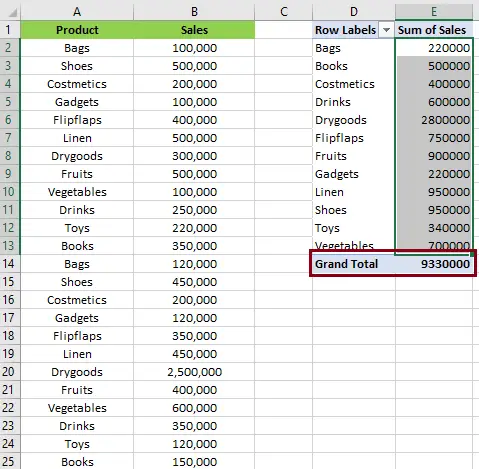
If you want to get the sum of your sales, just drag the sales to the “Values” field, and it will automatically display the sum of total sales that you will see in “Grand Total.”
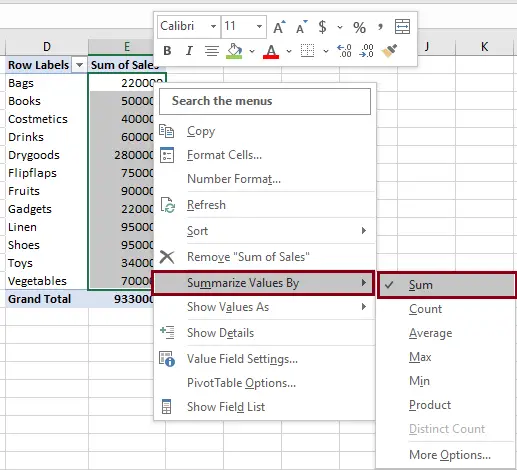
- You can also right-click the data that you want to get the sum of.
- Click “Summarize Values By” and select sum; that’s it.
Average Function
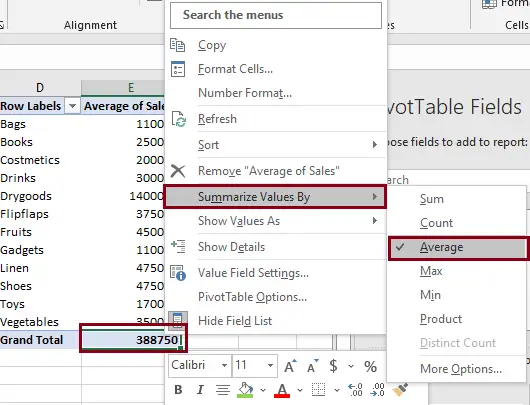
- You can also right-click the data that you want to get the average value.
- Click “Summarize Values By” and select average; that’s it.
- You’ll get the result; in our case, the average result is “388750.”
Max Function
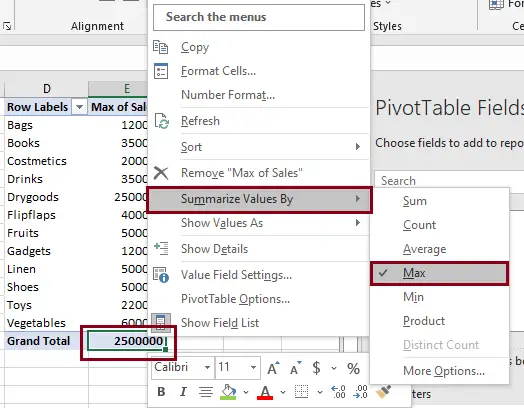
- You can also right-click the data that you want to get the maximum amount.
- Click “Summarize Values By” and select “Max”; that’s it.
- You’ll get the result; in our case, the maximum result is “2500000.”
Min Function
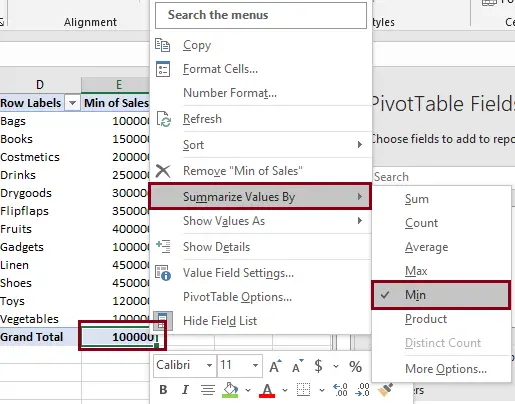
- You can also right-click the data that you want to get the minimum amount.
- Click “Summarize Values By” and select “Min”; that’s it.
- You’ll get the result; in our case, the minimum result is “100000.”
Conclusion
This article explains the benefits of a pivot table and what a pivot table is used for. It will enlighten you and help you understand why, most of the time, pivot tables are used by many.
Just by using pivot tables, you can create reports, generate charts, and perform in-depth data analysis.
Basically, if you’re working with huge amounts of data, it’s worth taking the time to learn how to use pivot tables to make your work much easier and more efficient.
Thank you very much for continuing to read until the end of this article. In case you have more questions or inquiries, feel free to comment below.

Caren Bautista
Technical Writer at PIES IT Solution
Responsible for crafting clear, well-structured, and beginner-friendly content across the platform. Handles the writing, proofreading, and editorial review of tutorials, guides, and documentation to ensure every article is accurate, readable, and easy to follow.
Expertise: Technical Writing · Content Creation · Documentation · Editorial Writing · JavaScript · TypeScript · Python · Python Errors · HTTP Errors · MS Excel · View all posts by Caren Bautista →