
The ER diagram for online shopping cart project reveals the relationships of the shopping cart entities within the database. This describes the logical structure of the system’s database or data storage. It is done by identifying the online shopping process entities, their properties, and the interactions between them.
The database design is sketched out using online shopping cart ER diagrams. This database sketch becomes the actual basis of the system’s data storage that will serve as data destination and source.
Shopping Cart ER Diagram: Details
The table shows the overall description of the ER Diagram for Shopping Cart. It has a complete overview of the project’s information.
| Name: | Shopping Cart ER Diagram |
| Abstract: | The online shopping cart ER diagram depicts the relationship between various entities. It can be thought of as a blueprint for your system (project) structure. |
| Diagram: | ER Diagram is also known as Entity Relationship Diagram |
| Tools Used: | Diagraming tools that provide ER diagram symbols. |
| Users: | Website, Applications, and Software. |
| Designer: | ITSourceCode.com |
What is a Shopping Cart?
Shopping cart software is part or equal to an e-commerce software that runs on a web server and allows visitors to an Internet site to choose things for purchase. Customers who shop online can create a wish list of products to buy using the software. Its goal is to aid online merchants with big client records by providing at least a simplified self-service option.
The entire purchasing process is automated with a shopping cart system. This statement explains that there is less work for online sellers and a simple transaction for online customers using a shopping cart. Sellers can save time, and money, and keep the customers happy by delegating the task to the shopping cart.
What is an ER Diagram?
The ER Diagram is referred to as the online shopping cart’s database design. This ER Diagram is the graphical depiction of relationships between all the entities involved in the system. Its major components are Entities, Attributes, and Relationships.
To build and troubleshoot relational databases, the online shopping cart ER Diagram is used. It works best with DFD (Data Flow Diagram), which is responsible for data movement. Designing the online shopping cart’s database would be much easier with the help of ER diagram.
Importance of ER Diagram for Shopping Cart
The importance of ER diagram for online shopping cart is to help in modeling its data storage or database. It is the basis of the project’s database foundation for construction. This entity-relationship diagram (ERD) also aids in defining the data types to be stored such as their attributes and characteristics.
In addition to that, the ER Diagram also describes how an entity interacts with other entities. All other real-world projects are presented with ER Diagrams (database designs). To display the details and attributes of a data store, the er diagram for online shopping cart is used in conjunction with its data flow diagram. They are very important in building a relational database because they let us visualize how data is connected in a generic fashion.
Entity-relationship diagrams are utilized in software engineering during the planning phase of software development. It aids in the identification of various system constituents and their interrelationships. Online Shopping ER Diagram is also used as the foundation of the shopping cart DFD (Dataflow Diagram)
Online Shopping Cart ER Diagram
ER Diagram of Online Shopping Cart shows the system entity and the supposed functions in each relationship. It is the supposed database design of the project. This conveys the data that would be present in the registration system, its characteristics, and its connection with other data (entity).
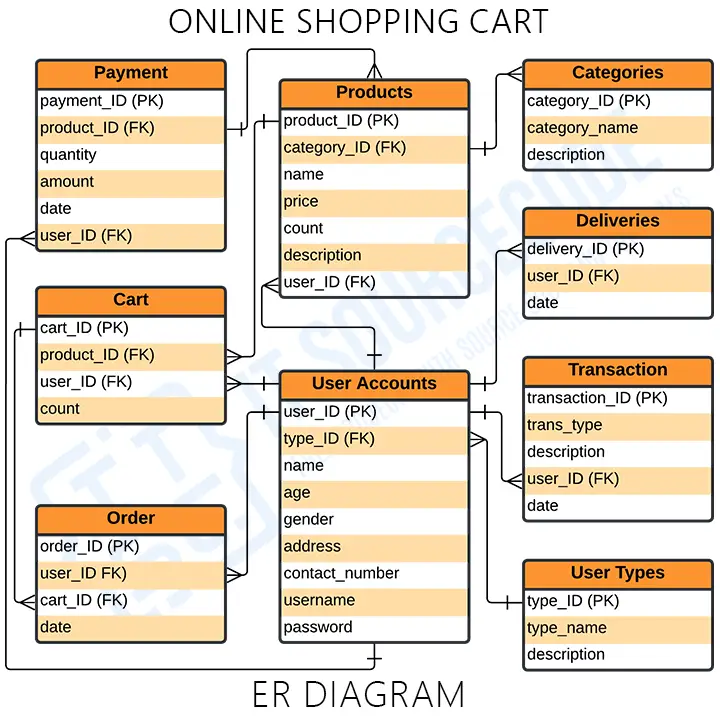
This diagram presents the entities’ relational model for the online shopping cart. It is used to enlighten you on how the back end of the database of the project works. The tables are made to meet the required specification of the system and provide much more specific details of each entity within the system.
ER Diagram for Online Shopping Cart: Tables
These tables below provide the complete database table details such as Field Name, Descriptions, data types, and character lengths. Each of these tables represents the characteristics and the attributes of data storage.
The field column presents the names of each database’s attributes, the description column gives the complete thought of each attribute, the type column is their data type and the length is for their character lengths.
Table Name: User Accounts
| Field | Description | Type | Length |
| user_ID (PK) | User ID | Int | 11 |
| type_ID (FK) | Type ID | Int | 11 |
| name | User Name | Varchar | 255 |
| age | Age | Int | 11 |
| gender | Gender | Varchar | 255 |
| address | Address | Text | |
| contact_number | Contact Number | Varchar | 255 |
| username | Username | Varchar | 255 |
| password | Password | Varchar | 255 |
Table Name: Products
| Field | Description | Type | Length |
| product_ID (PK) | Product ID | Int | 11 |
| category_ID (FK) | Category ID | Int | 11 |
| name | Name | Varchar | 255 |
| price | Price | Varchar | 255 |
| count | count | Int | 11 |
| description | Description | Text | |
| user_ID | Use ID | Int | 11 |
Table Name: User Types
| Field | Description | Type | Length |
| type_ID (PK) | Account Type ID | Int | 11 |
| type_name | Type Name | Varchar | 255 |
| description | Description | Text |
Table Name: Payment
| Field | Description | Type | Length |
| payment_ID (PK) | Login ID | Int | 11 |
| product_ID | Username | Varchar | 255 |
| quantity | Password | Varchar | 255 |
| amount | Amount | Int | 11 |
| date | Date | Date | |
| user_ID (FK) | User ID | Int | 11 |
Table Name: Cart
| Field | Description | Type | Length |
| cart_ID (PK) | Cart ID | Int | 11 |
| product_ID | Product ID | Int | 11 |
| user_ID (FK) | User ID | Int | 11 |
| Count | Count | Int | 11 |
Table Name: Order
| Field | Description | Type | Length |
| order_ID (PK) | Order ID | Int | 11 |
| user_Id (FK) | User ID | Int | 11 |
| cart_ID (FK) | Cart ID | Int | 11 |
| date | Date | Date |
Table Name: Categories
| Field | Description | Type | Length |
| category_ID (PK) | Category ID | Int | 11 |
| category_name | Category Name | Varchar | 255 |
| description | Description | Text |
Table Name: Deliveries
| Field | Description | Type | Length |
| delivery_ID (PK) | Delivery ID | Int | 11 |
| user_ID FK) | User ID | Int | 11 |
| date | Date | Date |
Table Name: Transaction
| Field | Description | Type | Length |
| transaction_ID (PK) | Transaction ID | Int | 11 |
| trans_ype | Transaction Type | Varchar | 255 |
| description | Description | Text | |
| user_ID (FK) | User ID | Int | 11 |
| date | Date | Date |
The tables given will be the basis for developers on how would they design the online shopping cart database. It has the complete description of the database and they will put this into the program or data storage the same as the names given to each of the tables. They will create a database with the attributes given as well as the value of each attribute.
Online Shopping Cart ERD [PDF]
The ER Diagram for Online Shopping PDF provides the information explaining the concepts of the project database. You may apply this information to your capstone project. You can also use it directly or modify its content depending on your project’s requirements.
How to create ER Diagram
Time needed: 5 minutes
Steps in building the ER Diagram for Online Shopping Cart with Cardinality Ratio.
- Step 1: Familiarize the ER Diagram (Entity Relationship Diagram) Symbols and Cardinality
Entity Relationship Diagram – shows the structure of data types in a project. It uses symbols to clarify its parts and relationships. Their symbols and applications must be familiarized before you build the ER Diagram.
ER Diagram Symbols:
• Fields: Fields are the parts of a table that define the entity’s characteristics. In the database that the ERD models, attributes are commonly thought of as rows.
• Keys is a technique to categorize data qualities. It is used to organize ER diagrams and assist users in modeling their databases to ensure that they are efficient. This is also used to connect different tables in a database.
– Primary Key: identifies a single entity instance which means a unique attribute or set of attributes.
– Foreign Key: is produced when data attributes have one too many relationships with other entities.
ER Diagram Cardinalities:
The styling of a line and its termination demonstrates cardinality and ordinality.
The greatest number of times an instance of one thing can be related to instances of another entity is referred to as cardinality.
While Ordinality refers to the fewest number of times a single entity instance can be linked to another. - Step 2: Finalize the entities included
Start designing your ER Diagram by finalizing the entities that must be included in your online shopping cart. This entity is represented by a rectangle, and you’ll want to leave plenty of room for them in future phases so you may add them to your design.
An entity set is a group of similar entities with shared properties. A table or a table’s attribute is an entity in a database management system. As a result, by depicting relationships between tables and their characteristics, an ER diagram displays the whole logical structure of a database. - Step 3: Add the attributes of each entity
After finalizing the entities, think about the qualities you’ll need to characterize each entity. The details of the various entities outlined in a conceptual ER diagram are supplied as attributes. Characteristics of an entity, a many-to-many relationship, or a one-to-one relationship are all examples of attributes. Multivalued attributes can be assigned to several values.
The entity’s attributes were represented by ovals and can be seen in the tables of the online shopping cart er diagram. These attributes can be a primary key or a foreign key in the database design of the project. Yoy ER diagram design could also be converted to the database of the system by declaring your right entities and their attributes. - Step 4: Describe the relationships (cardinality) between entities and attributes
To plot relationships between the ERD you will need the entities, their attributes, and relationships. You will base the data structure from the evaluated information to have the exact Entity Relationship Diagram.
A relationship is an association that describes how two entities interact. At the connector’s endpoints, the cardinality is indicated by a crow’s foot. One-to-one, one-to-many, and many-to-many are the three most common cardinal relationships. It’s the maximum number of times an instance of one entity can be linked to instances of another entity.
Conclusion:
You need to know the diagrams used to design and develop the Online Shopping Cart. That is to help you create a fully-functional system with the use of ER Diagram. Creating it will help you perceive the back end of the software. This will hold all the data that’ll enter and exit the system.
Related Articles:
- ER Diagram for Login Process
- ER Diagram for Login and Registration Page
- ER Diagram for Face Recognition Attendance System
- Course Registration System ER Diagram
- ER Diagram for Restaurant Management System
Recommended Articles:
- Activity Diagram for Shopping Cart
- Sequence Diagram for Online Shopping Cart
- Use Case Diagram for Online Shopping Cart
- Class Diagram for Online Shopping Cart
- Shopping Cart Data Flow Diagram
Inquiries
If you have inquiries or suggestions about the Shopping Cart ER Diagram, just leave us your comments below. We would be glad to know to concerns and suggestions and be part of your learning.
Keep us updated and Good day!
Official documentation
Working source code for this system
Download the actual implementation of this system in your preferred language. Each project includes source code, database, and setup instructions for BSIT capstone use.
Frequently asked questions
What is a ER diagram used for in BSIT capstone?
An ER diagram shows the database schema: entities (tables), attributes (columns), and relationships (foreign keys, cardinality). It goes in Chapter 3 alongside the class diagram to communicate the data storage design.
What tool should I use to draw the ER diagram?
Free options: draw.io (browser-based, saves to Google Drive), Lucidchart free tier, PlantUML (text-based, version-controllable), StarUML (30-day trial then reduced feature set), Visual Paradigm Community Edition. Paid options: Microsoft Visio, Lucidchart pro, Enterprise Architect. For BSIT capstones, draw.io is the most commonly used free tool.
How detailed does the ER diagram need to be for capstone defense?
Panel members expect the diagram to match the actual system implementation. Include every major class/use case/entity relevant to the system. Omit trivial helper classes. Every diagram element should have a clear justification. Aim for 1-2 diagrams that fully cover the system, not many partial ones.
Should I use black-and-white or colored diagrams?
Black-and-white is standard for capstone documentation to match the thesis format. Use color only if it improves clarity (e.g., grouping subsystems). Ensure text is readable at printed size (10pt minimum for labels).
Where does this diagram go in the capstone documentation?
Chapter 3 (System Design and Methodology) typically holds all UML diagrams. Introduce each diagram with a 1-paragraph description explaining what it shows and how to read it. Reference specific elements in the surrounding text so panel members can follow the design rationale.

Mary Grace G. Patulada
Programmer & Technical Writer at PIES IT Solution
Mary Grace G. Patulada (pen name ‘Nym’) is a programmer and writer at PIES IT Solution with a BSIT background from Carlos Hilado Memorial State College, Binalbagan Campus. Authored 370+ UML diagram tutorials and capstone documentation guides at itsourcecode.com. Specializes in UML (class, use case, activity, sequence, component, deployment), DFD, and ER diagrams for BSIT capstone projects.
Expertise: UML Diagrams · DFD · ER Diagrams · Use Case Diagrams · Activity Diagrams · Capstone Documentation · PHP · View all posts by Mary Grace G. Patulada →