

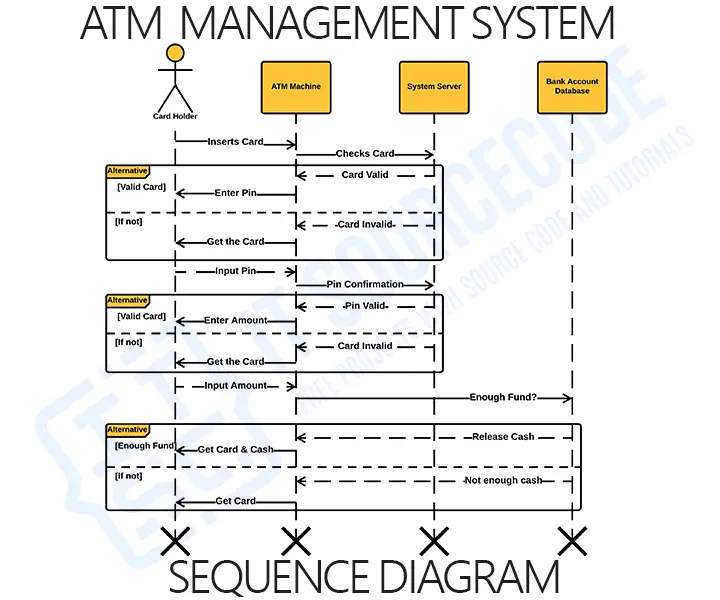
The Sequence Diagram For ATM System is a diagram that shows the sequence of messages or events between objects in the management system. It helps illustrate the sequence of messages that are passed between the actors and objects. Sequence diagrams are also able to explain in detail on how should ATM System control the structures between objects.
Now to create the Sequence Diagram for ATM System, you must be familiar first with its symbols. This is to know how would you emphasize the whole content of your ATM System. With the symbol familiarization, you’ll then easily understand the ways of the system development.
To have a better understanding on System development, there are a lot of UML Diagrams available on this site. Because aside from the System Sequence Diagram, there are still Use case, Activity and other essential Diagrams needed.
Simple Sequence Diagram (UML) for ATM Management System
Now in this article, I will be showing you the Sequence illustration of the ATM Management System. This design will enlighten you on how should the system or the actor approach each other.
This will also teach you how would you develop the system to achieve its desired behavior.
Additional Knowledge on the designed Sequence Diagram:
The ATM Management System is a sort of interaction sequence diagram that shows how the items interacts with an automated teller machine atm. Software engineers and business experts use these diagrams to understand the system’s requirements. Sequence Diagrams can also describe an existing process and the series of events.
The ATM Management System must have a designed diagram to define event sequences that will result in a desired outcome. The series in which communications appear is more important than the reply message itself. Additionally, the majority of sequence diagrams will show what messages are transmitted and in what order they usually occur.
An automated teller machine (ATM) is an electronic banking terminal from top to bottom and horizontal arrows. It enables consumers to conduct simple transactions without the assistance of a teller or branch personnel. They are activated by inserting cash (in the case of ATM depositing) or a debit/credit card with a magnetic stripe containing the user’s account number and PIN (for cash withdrawals).
Free tool
Generate your own Sequence Diagram in 3 minutes
Pick the system closest to your capstone, adjust the entities, and export it into your documentation. No drawing by hand.
Try the diagram generator →3 free diagrams every week. No credit card needed.
Conclusion
Customers can use an ATM to access their bank deposits or credit accounts. They can also perform financial operations, including cash withdrawals, balance checks, and credit transfers to and from mobile phones. The development of ATM Management System would be much efficient with the use of the UML Sequence Diagrams.
Related Articles:
Inquiries
If you have inquiries or suggestions about Sequence Diagram For ATM System, just leave us your comments below. We would be glad to hear to concerns and suggestions and be part of your learning.
How to read a sequence diagram
A sequence diagram shows the messages exchanged between objects over time, top to bottom. Each object has a vertical lifeline (dashed line); messages are horizontal arrows between them.
- Lifeline. Vertical dashed line representing the object’s presence during the interaction.
- Activation bar. Thin rectangle on a lifeline showing when the object is actively processing.
- Synchronous message. Solid arrow with filled triangle — the sender waits for a return.
- Asynchronous message. Solid arrow with stick arrowhead — sender does not wait.
- Return message. Dashed arrow with stick arrowhead going back to the sender.
- Self-message. Arrow that loops back to the same lifeline.
Combined fragments (control flow)
- alt. Alternative paths (if/else).
- opt. Optional path (like if without else).
- loop. Repeated messages.
- par. Parallel execution.
- ref. Reference to another sequence diagram.
Common capstone mistakes to avoid
- Missing return messages. Every synchronous call needs a return arrow.
- Wrong order of messages. Top-to-bottom = time order. Do not skip around.
- Too many objects. Focus on one use case per sequence diagram.
- No control-flow fragments. Use alt/opt/loop instead of drawing every combination separately.
Where the sequence diagram fits in Chapter 3
- Section 3.2 (System Design) alongside the class diagram.
- One diagram per major use case. Do not try to fit the whole system in one diagram.
- Reference the use case at the top of each sequence diagram: “Sequence for use case UC-05 Place Order.”
Official documentation
Working source code for this system
Download the actual implementation of this system in your preferred language. Each project includes source code, database, and setup instructions for BSIT capstone use.
- PHP: Online Blood Bank Management System in PHP with Source Code
- VB.NET: Test Bank System of Kabankalan Catholic College
- Java: Bank Management System Project In Java NetBeans Source Code
- Python: Bank Management System Project in Django with Source Code
- Django: Bank Management System Project in Django with Source Code
- Laravel: Online Banking Management System Project in Laravel with Source Code
Frequently asked questions
What is a sequence diagram used for in BSIT capstone?
A sequence diagram shows how objects interact over time to accomplish a specific use case: the messages, calls, and return values in chronological order. It complements the use case and class diagrams in Chapter 3.
What tool should I use to draw the sequence diagram?
Free options: draw.io (browser-based, saves to Google Drive), Lucidchart free tier, PlantUML (text-based, version-controllable), StarUML (30-day trial then reduced feature set), Visual Paradigm Community Edition. Paid options: Microsoft Visio, Lucidchart pro, Enterprise Architect. For BSIT capstones, draw.io is the most commonly used free tool.
How detailed does the sequence diagram need to be for capstone defense?
Panel members expect the diagram to match the actual system implementation. Include every major class/use case/entity relevant to the system. Omit trivial helper classes. Every diagram element should have a clear justification. Aim for 1-2 diagrams that fully cover the system, not many partial ones.
Should I use black-and-white or colored diagrams?
Black-and-white is standard for capstone documentation to match the thesis format. Use color only if it improves clarity (e.g., grouping subsystems). Ensure text is readable at printed size (10pt minimum for labels).
Where does this diagram go in the capstone documentation?
Chapter 3 (System Design and Methodology) typically holds all UML diagrams. Introduce each diagram with a 1-paragraph description explaining what it shows and how to read it. Reference specific elements in the surrounding text so panel members can follow the design rationale.

Mary Grace G. Patulada
Programmer & Technical Writer at PIES IT Solution
Mary Grace G. Patulada (pen name ‘Nym’) is a programmer and writer at PIES IT Solution with a BSIT background from Carlos Hilado Memorial State College, Binalbagan Campus. Authored 370+ UML diagram tutorials and capstone documentation guides at itsourcecode.com. Specializes in UML (class, use case, activity, sequence, component, deployment), DFD, and ER diagrams for BSIT capstone projects.
Expertise: UML Diagrams · DFD · ER Diagrams · Use Case Diagrams · Activity Diagrams · Capstone Documentation · PHP
· View all posts by Mary Grace G. Patulada →