

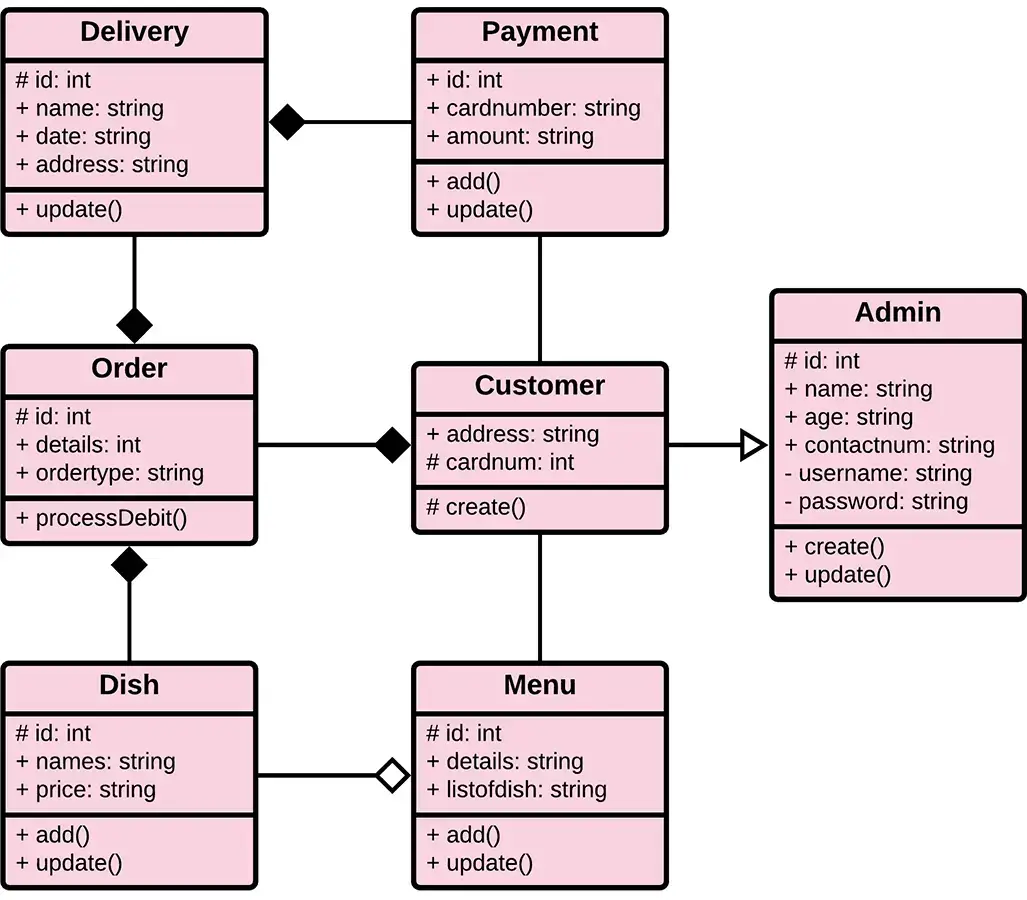
An Online Food Ordering System Class Diagram is a designed diagram that shows the system’s relationships and classes. This UML Class Diagram is made to guide programmers along with the online food ordering system’s development.
It contains the class attributes, operations, and methods, as well as the relationships between classes. These mentioned functions make sure that your online food ordering system development must be online with its functions.
Aside from that, you can learn more about Diagrams by reading the linked and suggested articles below.
- Online Food Ordering System UML Diagrams
- ER Diagram for Online Food Ordering System
- Component Diagram for Online Food Ordering System
Designing a Class Diagram for Online Food Ordering
You must be informed that an online food ordering system is a website or app that allows customers to examine the menu and place an order, as well as an admin interface that allows the restaurant to receive and fulfill the customer’s order.
Customers benefit from online food ordering since it assures that prices are precise and that there is less room for error when it comes time to pay the bill. Customers have to choose an item from a menu that has a price next to it. This makes sure that the right amount is always paid.
How to Construct Online Food Ordering System UML Class Diagram?
Now, to create the diagram for the online food ordering system, you will first determine the classes. So the classes that must be made in an order are the dishes, orders, customers, deliveries, payment, menu, and the admin or crew.
The mentioned classes were just general. If you want a more complex or wider scope of your online food ordering system, then you can add your desired classes. You must also include the database on your class diagram for your system.
Simple Class Diagram Online Food Ordering System
Here, I will be showing the structure of the sample constructed Online Food Ordering System Class Diagram.
- Determined the classes
The classes in the diagram are represented as boxes with three rectangles inside each box.
- Name the classes
The name of the class is in the top rectangle, the class’s properties are in the middle rectangle, and the class’s methods, which are also called operations, are in the bottom rectangle.
It was provided with its attributes with matching methods. This is constructed with the simple idea derived from the common function.
- Determined the attributes
After the classes were determined, which are symbolized by boxes.
The class process and class methods were designated with their corresponding attributes and show the class methods.
Their relationships are also plotted to show the connections between classes and their multiplicity.
- The output of the class diagram
Extra Tips for Online Food Ordering UML Class Diagram
To design your class diagram, you may use platforms and editing tools online.
These tools are helpful since they already have the needed symbols to illustrate your class diagram.
You just have to plot the included actors and objects. Then you will enter the appropriate messages that the system requires.
The platforms or online tools that you may use are:
- Lucidchart
- Creately
- SmartDraw
- Edrawmax
- Canva
Conclusion
The Online Food Ordering System is a model that shows its classes and how they work together. The diagram shows the names of the classes and their attributes, as well as their links and methods.
It is the most important type of UML diagram, which is important for making software. It’s a way to show the structure of the system in detail, including its properties and how it works.
Inquiries
Now let me ask you something. What have you learned through the discussion? May this article help you with your projects in the future!
If you have inquiries or suggestions about Online Food Ordering System Class Diagram | UML just leave us your comments below.
Keep us updated and Good day!
📌 Looking for your capstone project idea?
Browse our complete list of 150 Best Capstone Project Ideas for IT Students (2026 Edition), covering Web, Mobile, AI, Database, and Game Development capstone topics with full project descriptions.
How to read a class diagram
A class diagram has three components in each class box: name (top), attributes (middle), operations/methods (bottom). Relationships between classes are shown as lines with different symbols.
- Association. Plain line means two classes know about each other.
- Inheritance / Generalization. Line with a hollow arrowhead pointing to the parent class.
- Realization. Dashed line with hollow arrowhead pointing to an interface.
- Aggregation. Line with a hollow diamond at the whole end (e.g., Department has Employees).
- Composition. Filled diamond at the whole end (e.g., House is composed of Rooms).
- Dependency. Dashed arrow: one class uses another temporarily.
Cardinality notation
- 1. Exactly one
- 0..1. Zero or one (optional)
- 1..*. One or more (mandatory + many)
- 0..* or *. Zero or more (any number)
- 1..5. Between 1 and 5
Common capstone mistakes to avoid
- Missing cardinality. Every association must have numbers on both ends.
- Getters/setters listed as separate methods. Show only meaningful business methods.
- No visibility modifiers. Use + (public), – (private), # (protected).
- Confusing aggregation vs composition. Composition means the part cannot exist without the whole.
Where the class diagram fits in Chapter 3
- Section 3.2 (Object-Oriented Analysis and Design).
- Reference from the ER diagram. Show how database tables map to classes.
- Reference from the use case diagram. Each use case triggers operations on one or more classes.
- Include a legend. Explain the notation for panel members.
Official documentation

Mary Grace G. Patulada
Programmer & Technical Writer at PIES IT Solution
Mary Grace G. Patulada (pen name ‘Nym’) is a programmer and writer at PIES IT Solution with a BSIT background from Carlos Hilado Memorial State College, Binalbagan Campus. Authored 370+ UML diagram tutorials and capstone documentation guides at itsourcecode.com. Specializes in UML (class, use case, activity, sequence, component, deployment), DFD, and ER diagrams for BSIT capstone projects.
Expertise: UML Diagrams · DFD · ER Diagrams · Use Case Diagrams · Activity Diagrams · Capstone Documentation · PHP
· View all posts by Mary Grace G. Patulada →
Working source code for this system
Download the actual implementation of this system in your preferred language. Each project includes source code, database, and setup instructions for BSIT capstone use.
- PHP: [Complete] Online Food Ordering System In CodeIgniter
- Python: Python Django Online Food Ordering System with Source Code
- Django: Python Django Online Food Ordering System with Source Code
- CodeIgniter: [Complete] Online Food Ordering System In CodeIgniter
- ASP.NET: Online Food Ordering System Project in ASP.net FREE Download
Frequently asked questions
What is a class diagram used for in BSIT capstone?
A class diagram shows the static structure of the system: classes, attributes, methods, and relationships (inheritance, association, aggregation, composition). It goes in Chapter 3 of the capstone documentation and communicates the object-oriented design of the system.
What tool should I use to draw the class diagram?
Free options: draw.io (browser-based, saves to Google Drive), Lucidchart free tier, PlantUML (text-based, version-controllable), StarUML (30-day trial then reduced feature set), Visual Paradigm Community Edition. Paid options: Microsoft Visio, Lucidchart pro, Enterprise Architect. For BSIT capstones, draw.io is the most commonly used free tool.
How detailed does the class diagram need to be for capstone defense?
Panel members expect the diagram to match the actual system implementation. Include every major class/use case/entity relevant to the system. Omit trivial helper classes. Every diagram element should have a clear justification. Aim for 1-2 diagrams that fully cover the system, not many partial ones.
Should I use black-and-white or colored diagrams?
Black-and-white is standard for capstone documentation to match the thesis format. Use color only if it improves clarity (e.g., grouping subsystems). Ensure text is readable at printed size (10pt minimum for labels).
Where does this diagram go in the capstone documentation?
Chapter 3 (System Design and Methodology) typically holds all UML diagrams. Introduce each diagram with a 1-paragraph description explaining what it shows and how to read it. Reference specific elements in the surrounding text so panel members can follow the design rationale.