
The blood bank management system ER diagram shows the entities’ relationships to form the database design. It is also used to describe the logical structure of the system’s database or data storage.
Designing an ER diagram is done by identifying the system’s entities, their properties, and interactions.
Moreover, the database design is sketched out using blood bank management system ER diagrams. The database sketch then becomes the actual basis of the system’s data storage. This will also serve as the data destination and source.
Blood Bank Management System ER Diagram: Details
This table shows the overall description of the ER diagram for blood bank management system. It has a complete overview of the project’s information.
| Name: | Blood Bank Management System ER (Entity-Relationship) Diagram |
| Abstract: | The blood bank management system ER diagram draws the relationship between various entities. In fact, ERD is considered a blueprint of the system (project) structure. |
| Diagram: | ER Diagram is also known as Entity Relationship Diagram |
| Tools Used: | Diagraming tools that provide ER diagram symbols. |
| Users: | Hospital admin, Bloodletting Personnel, Donors, and Recipients. |
| Designer: | ITSourceCode.com |
Blood Bank Management System Definition
All blood donated at blood bank must be treated safely and efficiently. It should be noted so that individuals in need of blood will not contact with infections or illnesses. The Blood Bank Management System (BBMS) is a web-based system that can assist with blood bank management.
Additionally, the results of the blood tests on each blood bag could be managed efficiently. The blood bank software also allows patients to obtain information about the blood group they require from the central inventory.
Blood Bank Management System Features
- Blood Bank Management – this feature lets the admin manage the information of blood donors and recipients.
- Donor Management – this gathers important information about the donor. It is also used to track important donor activities.
- Manage Recipients – This system can also manage the recipients regarding requests for blood. They also trace if the recipient is applicable to have the blood.
- Transaction and Reports Management – This feature will store the transactions made including their information and the reports of every transaction and timetables.
What is an ER Diagram?
The ER Diagram is referred to as the blood bank management system’s database design. Both ER diagram and database design illustrate the relationships between all the system’s entities. Its major components are Entities, Attributes, and Relationships.
Additionally, the ER diagram is used to build and troubleshoot relational databases. It also works best with blood bank management system DFD, which is responsible for data movement. Creating the blood bank system database design would also be much easier with the help of ER diagram.
Importance of ER Diagram
The importance of ER diagram for blood bank management system is to help in modeling its database design. It becomes the basis of the project’s database foundation for construction. This ERD also aids in defining the data types to be stored such as their attributes and characteristics.
Entity-relationship diagrams are utilized in software engineering during the planning phase of software development. It aids in the identification of various system constituents and their interrelationships. This ER Diagram is also used as the foundation of the blood bank system UML Diagrams.
Entity Relationship Diagram for Blood Bank Management System
ER Diagram of Blood Bank Management System shows the system entity relationships in each entity and their supposed functions in each relationship.
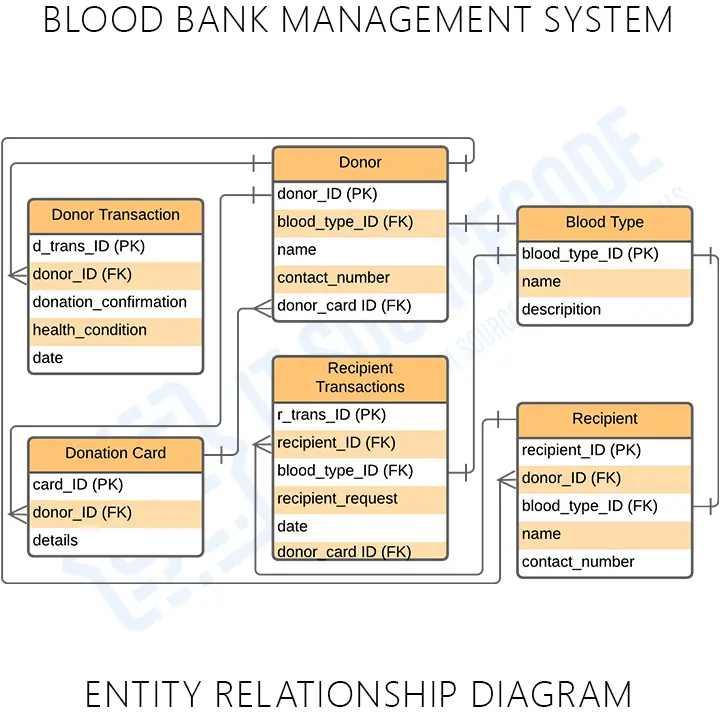
Based on the image above, the ER diagram for Attendance System is presented in tables. The tables include donor, recipient, donor’s transaction, recipients transaction, donation card and blood type.
The tables are made to meet the required specification of the system and provide much more specific details of each entity within the system.
Blood Bank Management System Entity Relationship Diagram Tables
These tables below provide the complete details such as Field Name, Descriptions, data types, and character lengths. Each of these tables represents the characteristics and the attributes of data storage.
Specifically, the field column presents the names of each database’s attributes, the description column gives the complete thought of each attribute, the type column is their data type and the length is for their character lengths.
Table Name: Donor
| Field | Description | Type | Length |
| donor_ID (PK) | Donor ID | Int | 11 |
| blood_type (FK) | Blood Type | Int | 11 |
| name | Donor’s Name | Varchar | 255 |
| contact_number | Donors’ Contact | Int | 11 |
| donor_card | Donors’ Card | Int | 11 |
Table Name: Donor Transactions
| Field | Description | Type | Length |
| donor_trans_ID (PK) | Donor’s Transaction ID | Int | 11 |
| donor_ID (FK) | Donor ID | Int | 11 |
| donation_confirmation | Confirmation for Donation | Varchar | 255 |
| health_condition | Health Condition | Varchar | 255 |
| date | Donation Date | Date |
Table Name: Recipient Transactions
| Field | Description | Type | Length |
| recipient_trans_ID (PK) | Recipient Transaction ID | Int | 11 |
| recipient_ID (FK) | Recipient ID | Int | 11 |
| recipient_request | Account Name | Varchar | 255 |
| date | Recipient Request Date | Date | |
| donor_card (FK) | Donor Card | Varchar | 255 |
Table Name: Blood Type
| Field | Description | Type | Length |
| blood_type_ID (PK) | Blood Type ID | Int | 11 |
| name | Name | Varchar | 155 |
Table Name: Donation Card
| Field | Description | Type | Length |
| card_ID (PK) | Transaction ID | Int | 11 |
| donor_ID (FK) | Transaction Name | Int | 11 |
All in all, the tables serve as the basis for developers on how to design the blood bank management system database. It has a complete description of the database. Then the developers will put this into the program.
Blood Bank Management System ER Diagram [PDF]
The ER Diagram for Blood Bank Management System PDF explains the concepts of the project database. In fact, you may apply this information to your capstone project. You can also use it directly or modify its content depending on your project’s requirements.
How to create ER Diagram
Time needed: 5 minutes
Steps in building the ER Diagram for Blood Bank Management System with Cardinality Ratio.
- Step 1: Familiarize the ER Diagram Symbols and Cardinality
First, you need to familiarize the needed symbols.
ER Diagram Symbols:
• Fields: Fields are the parts of a table that define the entity’s characteristics. In the database that the ERD models, attributes are also known as rows.
• Keys is a technique to categorize data qualities. It is used to organize ER diagrams and assist users in modeling their databases. This is also used to connect different tables in a database.
– Primary Key: identifies a single entity instance which means a unique attribute or set of attributes.
– Foreign Key: is produced when data attributes have one too many relationships with other entities. - Step 2: Finalize the entities included
Second, design your ER Diagram by finalizing the entities that must be included in your blood bank management system. This entity is represented by a rectangle.
- Step 3: Add the attributes of each entity
Next, is to add the attributes to each entity. Think about the qualities you’ll need to characterize an entity. The details of the various entities outlined in a conceptual ER diagram are supplied as attributes.
The entity’s attributes were represented by ovals and can be seen in the tables. Then, the design could be converted to the database of the system. - Step 4: Describe the relationships (cardinality) between entities and attributes
Finally, plot relationships between the entities.
A relationship is an association that describes how the entities interact. Additionally, the cardinality is indicated by a crow’s foot at the connector’s endpoints.
Specifically, one-to-one, one-to-many, and many-to-many are the three most common cardinal relationships. It’s the maximum number of times that one entity can be linked to another entity.
Conclusion:
In conclusion, the ER diagram is not only applied for Blood Bank Management System Database Design but also for the foundation of other diagrams. ER diagram is also used to specify the exact destination and source of data.
Furthermore, this entity-relationship diagram (ERD) is a very important part of system development. That is because ERD serves as the project backbone. So, If you want more knowledge about ER Diagrams, you can also visit the Related Articles.
Related Articles:
- ER Diagram for Order Management System
- ER Diagram for Login Process
- Course Registration System ER Diagram
- ER Diagram for Login and Registration Page
- ER Diagram for Face Recognition Attendance System
Inquiries
If you have inquiries or suggestions about the Blood Bank Management System ER Diagram, just leave us your comments below. We would be glad to know to concerns and suggestions and be part of your learning.
Keep us updated and Good day!
Official documentation
Working source code for this system
Download the actual implementation of this system in your preferred language. Each project includes source code, database, and setup instructions for BSIT capstone use.
- PHP: Online Blood Bank Management System in PHP with Source Code
- Java: Bank Management System Project In Java NetBeans Source Code
- Python: Blood Bank Management System Project in Django
- Django: Blood Bank Management System Project in Django
- Laravel: Online Banking Management System Project in Laravel with Source Code
Frequently asked questions
What is a ER diagram used for in BSIT capstone?
An ER diagram shows the database schema: entities (tables), attributes (columns), and relationships (foreign keys, cardinality). It goes in Chapter 3 alongside the class diagram to communicate the data storage design.
What tool should I use to draw the ER diagram?
Free options: draw.io (browser-based, saves to Google Drive), Lucidchart free tier, PlantUML (text-based, version-controllable), StarUML (30-day trial then reduced feature set), Visual Paradigm Community Edition. Paid options: Microsoft Visio, Lucidchart pro, Enterprise Architect. For BSIT capstones, draw.io is the most commonly used free tool.
How detailed does the ER diagram need to be for capstone defense?
Panel members expect the diagram to match the actual system implementation. Include every major class/use case/entity relevant to the system. Omit trivial helper classes. Every diagram element should have a clear justification. Aim for 1-2 diagrams that fully cover the system, not many partial ones.
Should I use black-and-white or colored diagrams?
Black-and-white is standard for capstone documentation to match the thesis format. Use color only if it improves clarity (e.g., grouping subsystems). Ensure text is readable at printed size (10pt minimum for labels).
Where does this diagram go in the capstone documentation?
Chapter 3 (System Design and Methodology) typically holds all UML diagrams. Introduce each diagram with a 1-paragraph description explaining what it shows and how to read it. Reference specific elements in the surrounding text so panel members can follow the design rationale.

Mary Grace G. Patulada
Programmer & Technical Writer at PIES IT Solution
Mary Grace G. Patulada (pen name ‘Nym’) is a programmer and writer at PIES IT Solution with a BSIT background from Carlos Hilado Memorial State College, Binalbagan Campus. Authored 370+ UML diagram tutorials and capstone documentation guides at itsourcecode.com. Specializes in UML (class, use case, activity, sequence, component, deployment), DFD, and ER diagrams for BSIT capstone projects.
Expertise: UML Diagrams · DFD · ER Diagrams · Use Case Diagrams · Activity Diagrams · Capstone Documentation · PHP · View all posts by Mary Grace G. Patulada →