

The use case diagram for online event management system is the behavioral diagram that summarizes activities done in the event management system and its user details. It depicts the graphical representation of the system’s behavioral structure.
Additionally, the diagram consists of processes (use cases) and users or “actors”. It uses defined symbols to describe the overall workflow of the event management system.
Project Overview
| Name: | Event Management System Use Case Diagram in UML |
| Users: | Event Coordinators and Clients |
| Tools Used: | Any Diagram tools that provide use case diagram symbols. |
| Designer: | ITSourceCode.com |
What is a Use Case Diagram?
The use case diagram in software engineering shows the sample adaptive behavior of the event management system. It encapsulates the project’s functionality by incorporating use cases, actors, and their interactions.
Moreover, the diagram assists you in defining and organizing project requirements. This also provides a clear picture of the user and system relationships. Therefore, this diagram depicts the high-level functionality of a system including how the user interacts with it.
Importance of UML Use Case Diagram
To help the developers and enterprises in developing the system is the importance of the UML use case diagram. It includes the procedures from the viewpoint of users.
Furthermore, the diagram is the analysis methodology aids to identify, clarify, and organize project needs. This diagram works best with other UML Diagrams for Event Management System. Other UML diagrams include activity, class, sequence, deployment, and component diagrams.
Use Case Diagram for Event Management System
The sample system use case diagram includes actors, processes (use case), and their relationships.
Event Management System General Use Case Diagram
This diagram shows the general processes or functions that the system could do and is based on the transactions needed in an Event Management.
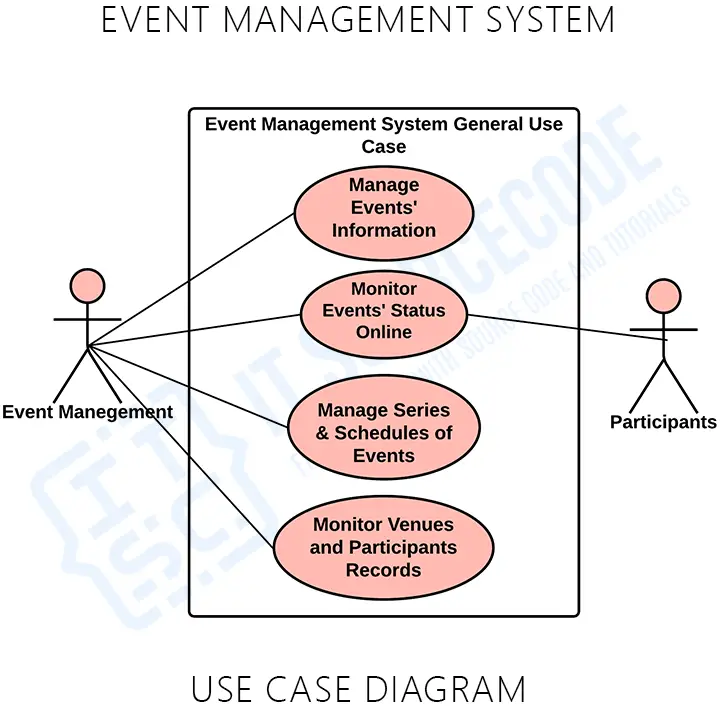
The general use case is the most common application of a use case diagram. It shows the system’s main components as well as the flow of information between them. With the help of this general use case, the programmer will have the basis on what could be put into consideration in creating the event management system.
Use Case Diagram using Include and Extend
Include and extend are indications that elaborate the proceeding diagrams. The label “include” indicates that the sub-processes of the main processes are included to complete the task. The “extend”, on the other hand, declares that the sub-processes can only be performed when needed.
This diagram specifies the included activities in completing a process or task. It will also help users determine the right way of managing the Event Management System.
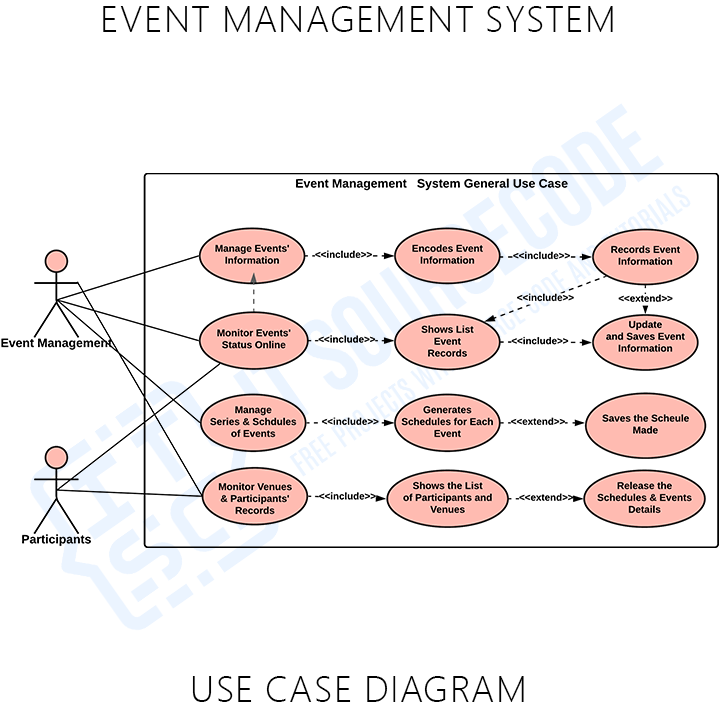
The role of this Use case Diagram using the include and Extend label is to inform your readers and users that some tasks and processes may be completed without invoking all the subtasks. They were only used when they were called or needed.
You can add more to this and it is up to you how will you create your use case diagram. Only be precise with your information and consider the use cases that should be included.
Downloadable Pdf File
How to draw a Use Case Diagram?
Time needed: 2 minutes
Here’s the complete guide on how to draw a use case diagram for event management system.
- Step 1: Familiarize Use Case Diagram Symbols
For beginners in the field of designing the diagram, you need first to familiarize the symbols to be used.
- Step 2: Determine the targeted users
The next step is to determine your targeted users. They will be the ones to use your project.
You may ask the users about the typical activities done in the event system.
- Step 3: Analyze the use cases included
The gathered information from the users needs to be evaluated to know the general use cases.
From the general use cases, you will see the sub-cases that are included. But, only the useful processes and circumstances related to the event management system.
- Step 4: Plot the Use Case Diagram
To plot the diagram you will need the users, use cases, container (scope), and their indicators (association). You will base the flow of use cases on the evaluated information from the users.
You need to place first the users involved.
Then place the figured use cases included in doing the process.
After that, you will trace the association of the use cases to know the interactions between the user/s and the system.
Finally, put the container in the plotted diagram to separate the objects’ (users and system) scope.
Conclusion:
The use case diagram is one of the methods that contribute to the event management system design and development. It helps developers know the possible inputs and scenarios that the project should process and perform.
Furthermore, you will find out the needed processes and connect them to the other UML Diagrams. The diagram is also applicable in modeling the software’s use cases (processes). It also captures the system’s flow from one process to the next.
Related Articles:
Inquiries
If you have inquiries or suggestions about the Use Case Diagram for Event Management System, just leave us your comments below.
How to read a use case diagram
A use case diagram has 3 main elements: actors (stick figures outside the system), use cases (ovals inside the system boundary), and relationships between them.
- Actor. A role played by a human or external system that interacts with the system.
- Use case. A specific goal the actor accomplishes with the system.
- System boundary. The rectangle around the use cases marks what is inside vs outside.
- Association. Line between an actor and a use case they perform.
Use case relationships
- Include. Dashed arrow with include stereotype — one use case ALWAYS calls another (e.g., Login is included in Place Order).
- Extend. Dashed arrow with extend stereotype — an optional add-on to a base use case (e.g., Apply Discount extends Place Order).
- Generalization. Solid arrow with hollow triangle — one actor or use case is a specialized form of another.
Common capstone mistakes to avoid
- Too granular. Do not create a use case for each button. Focus on business goals.
- Missing actors. Every use case must be associated with at least one actor.
- Confusing include vs extend. Include is mandatory; Extend is optional.
- No system boundary. Missing rectangle is a common panel critique.
Where the use case diagram fits in Chapter 3
- Section 3.1 (System Overview) or 3.2 (Functional Requirements).
- List each use case with a brief description in a table alongside the diagram.
- Reference each use case when explaining the workflow in later sections.
Official documentation
Working source code for this system
Download the actual implementation of this system in your preferred language. Each project includes source code, database, and setup instructions for BSIT capstone use.
Frequently asked questions
What is a use case diagram used for in BSIT capstone?
A use case diagram shows what the system does from the user’s perspective: actors, use cases, and their relationships (include, extend, generalization). It goes in Chapter 3 and communicates the functional requirements of the system.
What tool should I use to draw the use case diagram?
Free options: draw.io (browser-based, saves to Google Drive), Lucidchart free tier, PlantUML (text-based, version-controllable), StarUML (30-day trial then reduced feature set), Visual Paradigm Community Edition. Paid options: Microsoft Visio, Lucidchart pro, Enterprise Architect. For BSIT capstones, draw.io is the most commonly used free tool.
How detailed does the use case diagram need to be for capstone defense?
Panel members expect the diagram to match the actual system implementation. Include every major class/use case/entity relevant to the system. Omit trivial helper classes. Every diagram element should have a clear justification. Aim for 1-2 diagrams that fully cover the system, not many partial ones.
Should I use black-and-white or colored diagrams?
Black-and-white is standard for capstone documentation to match the thesis format. Use color only if it improves clarity (e.g., grouping subsystems). Ensure text is readable at printed size (10pt minimum for labels).
Where does this diagram go in the capstone documentation?
Chapter 3 (System Design and Methodology) typically holds all UML diagrams. Introduce each diagram with a 1-paragraph description explaining what it shows and how to read it. Reference specific elements in the surrounding text so panel members can follow the design rationale.

Mary Grace G. Patulada
Programmer & Technical Writer at PIES IT Solution
Mary Grace G. Patulada (pen name ‘Nym’) is a programmer and writer at PIES IT Solution with a BSIT background from Carlos Hilado Memorial State College, Binalbagan Campus. Authored 370+ UML diagram tutorials and capstone documentation guides at itsourcecode.com. Specializes in UML (class, use case, activity, sequence, component, deployment), DFD, and ER diagrams for BSIT capstone projects.
Expertise: UML Diagrams · DFD · ER Diagrams · Use Case Diagrams · Activity Diagrams · Capstone Documentation · PHP
· View all posts by Mary Grace G. Patulada →