

In this article, you will know how to draw the DFD for Student Information System.
The student information system is a project designed to aid the everyday processes of student information management. To know what are the student registration system’s processes, apply the DFD.
The DFD stands for Data Flow Diagram and it has the following levels:
- Context Diagram (Level 0)
- DFD Level 1
- DFD Level 2
Context Diagram – Student Information System
The primary idea behind this project is a diagram showing the context of the student information system. At this level, the overall procedure that delivers the notion of what should be considered in the project is carried out.
For example:
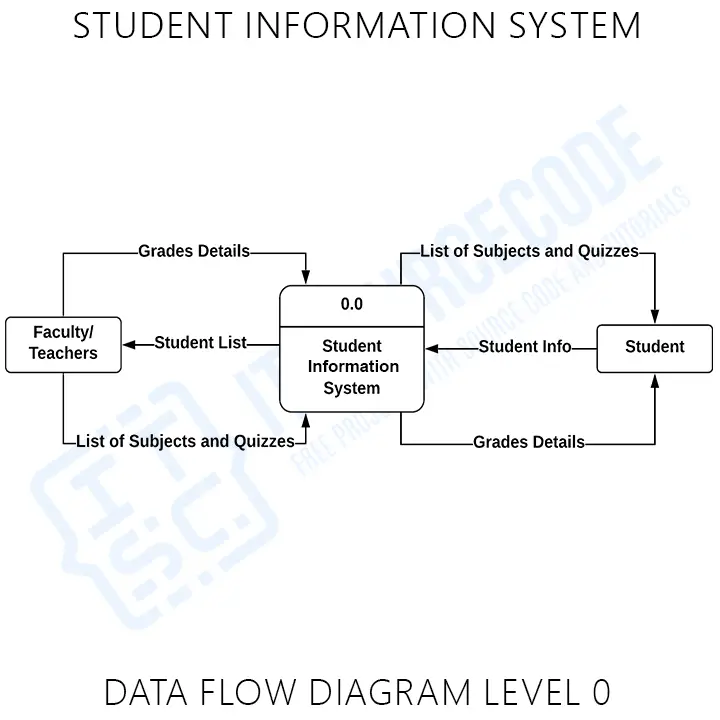
The example illustrates the entire concept of the project in a single step. It initiates the generation of sub-processes necessary to complete the “student information process.”
The example shows how a single process involves external entities interacting with the system. The following entities are external:
- Faculty or Teachers
- Student
This group of entities could be in the form of users, organizations, or other systems. Even though they are a part of the process, they are referred to as “external” since they fall outside the system’s purview.
Moving on to the sub-processes of the student information system, we have DFD level 1.
1st Level DFD – Student Information System
Student information system: DFD level 1 discloses all possible subprocesses. Consequently, DFD level 0 is expanded to DFD level 1. Take a look at the following example to get an idea of the kinds of steps that could fall under the main idea.
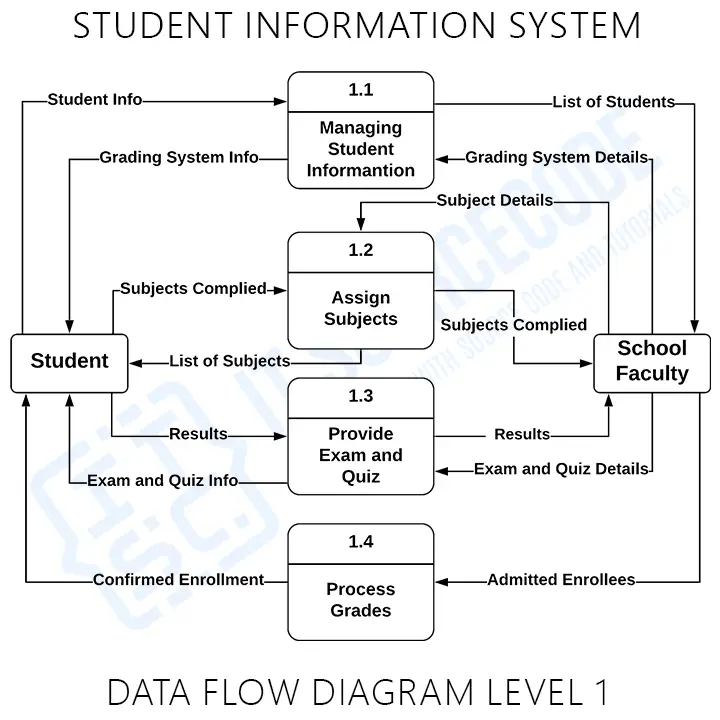
The example above proves how the context of the system operates. This level reveals the existence of four potential sub-processes, namely:
- Managing Student’s Information
- Assign Subjects
- Provide Exam and Quiz
- Process Quiz
Please note that the sub-processes concepts were drawn from actual student information management. You can also tweak the offered concept to suit your needs or utilize it as-is.
At this point, you have a comprehensive understanding of the project’s scope and may conclude your job. However, the next level may intrigue you regarding its nature and operation.
2nd Level DFD – Student Admission System
The DFD level 2 represents the greatest level of concept abstraction among the three levels. It is because this level identifies the processes (if any) beneath the sub-process in level 1.
Let’s talk about an important part of the data flow diagram at this level, though.
For example, Databases:
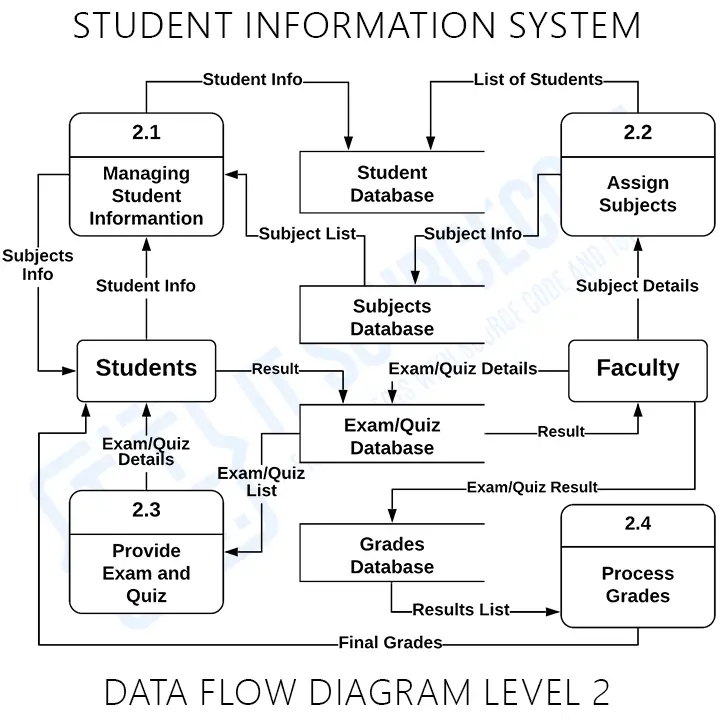
The example is intended to illustrate one of the subprocesses in level 1. Instead, it focuses more on the system’s database (data store).
The following are the data stores that the system requires:
- Students Database
- Subjects Database
- Exam and Quiz Database
- Grades Database
These data repositories are responsible for maintaining data security and accessibility. The system will only provide the information to the student who requested it.
The student admission system is a project that delivers internet-based enrollment processing that is efficient. This indicates that the system should function similarly to manual enrolment. The main difference is that students can enroll whenever and wherever they are with this system.
Remember that when defining the sub-processes of level 1, this level may have several examples. It depends on the number of sub-processes that require discussion.
Now, are you curious about the symbols we employed in the preceding diagrams?
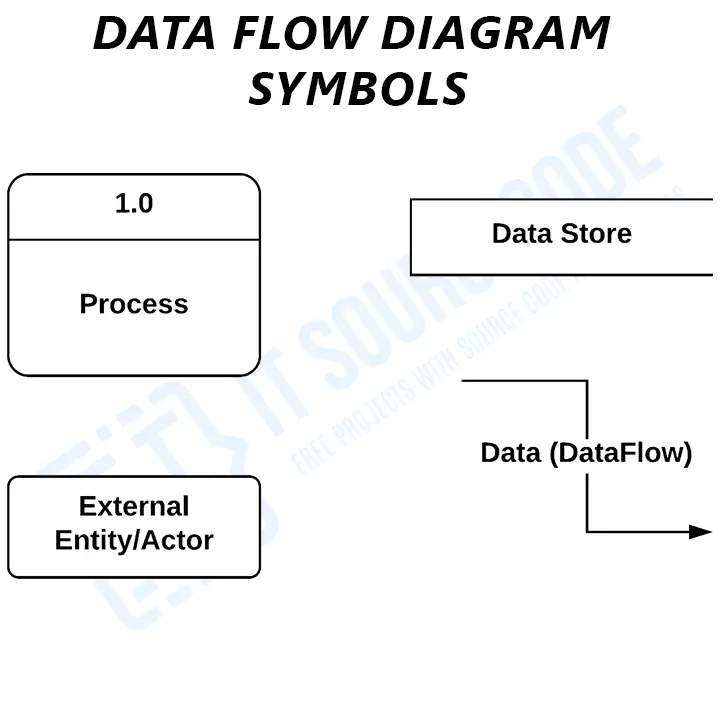
Data flow is the flow of information between external entities, processes, and data repositories. It illustrates the relationship between the other components. In addition, a labeled arrow is utilized to depict the data flow.
The data store is the project’s database or backbone. It stores and protects all inputted data for future use.
The external entities are the source and target of the system’s information, and they interact with it. Utilizing the phrases “terminators,” “sources,” “links,” and “actors,” users identify entities.
The DFD process component alters and generates output data. In addition, it does calculations, sorts data based on logic, and controls data flow according to project requirements.
Conclusion
The data flow diagram for the student information system depicts the movement of data from one level to another.
The Level 0 or Context Diagram illustrates the single and primary process of the student admissions system, as well as the principal users and data. Then, levels 1 and 2 of the DFD show how the system works and how data flows through it.
How to read a data flow diagram
A DFD shows how data moves through the system. Unlike UML, DFD is not part of the UML standard but is standard in structured analysis and BSIT capstone documentation.
- Process. Circle or rounded rectangle representing a transformation of data.
- Data store. Open-ended rectangle representing persistent storage.
- External entity. Rectangle outside the system representing a source or destination.
- Data flow. Arrow labeled with the data being moved.
DFD levels
- Level 0 (Context diagram). The entire system as a single process.
- Level 1. Explodes the context into 3-7 major sub-processes.
- Level 2. Further decomposes each Level 1 process.
- Level 3+. Rarely needed.
Common capstone mistakes
- Skipping Level 0. Always start with the context diagram.
- Process with no output. Every process must produce data.
- Data flow between two external entities. Data flows must involve at least one process.
- Unbalanced levels. Inputs and outputs at Level N must match Level N-1.
- Missing data store labels. Every data store needs a name.
Where the DFD fits
- Section 3.2 (System Analysis).
- Include all levels 0-2.
- Number each process (1.0, 1.1, etc.).
Official documentation
Working source code for this system
Download the actual implementation of this system in your preferred language. Each project includes source code, database, and setup instructions for BSIT capstone use.
Frequently asked questions
What is a data flow diagram used for in BSIT capstone?
A data flow diagram shows how data moves through the system: processes, data stores, external entities, and data flows. Level 0 (context) shows the whole system as one process; Level 1 breaks it into major sub-processes; Level 2 details each sub-process.
What tool should I use to draw the data flow diagram?
Free options: draw.io (browser-based, saves to Google Drive), Lucidchart free tier, PlantUML (text-based, version-controllable), StarUML (30-day trial then reduced feature set), Visual Paradigm Community Edition. Paid options: Microsoft Visio, Lucidchart pro, Enterprise Architect. For BSIT capstones, draw.io is the most commonly used free tool.
How detailed does the data flow diagram need to be for capstone defense?
Panel members expect the diagram to match the actual system implementation. Include every major class/use case/entity relevant to the system. Omit trivial helper classes. Every diagram element should have a clear justification. Aim for 1-2 diagrams that fully cover the system, not many partial ones.
Should I use black-and-white or colored diagrams?
Black-and-white is standard for capstone documentation to match the thesis format. Use color only if it improves clarity (e.g., grouping subsystems). Ensure text is readable at printed size (10pt minimum for labels).
Where does this diagram go in the capstone documentation?
Chapter 3 (System Design and Methodology) typically holds all UML diagrams. Introduce each diagram with a 1-paragraph description explaining what it shows and how to read it. Reference specific elements in the surrounding text so panel members can follow the design rationale.

Mary Grace G. Patulada
Programmer & Technical Writer at PIES IT Solution
Mary Grace G. Patulada (pen name ‘Nym’) is a programmer and writer at PIES IT Solution with a BSIT background from Carlos Hilado Memorial State College, Binalbagan Campus. Authored 370+ UML diagram tutorials and capstone documentation guides at itsourcecode.com. Specializes in UML (class, use case, activity, sequence, component, deployment), DFD, and ER diagrams for BSIT capstone projects.
Expertise: UML Diagrams · DFD · ER Diagrams · Use Case Diagrams · Activity Diagrams · Capstone Documentation · PHP
· View all posts by Mary Grace G. Patulada →