

Credit Card Processing System Activity Diagram
The UML activity diagram is a diagram that presents the flow of credit card processing system activities. It is one of the methods used to document behavior, activities, and software development.
Additionally, the activity diagram uses symbols to define the overall workflow of the card processing system. It is composed of activities, decisions, and paths (flows).
Project Details
| Name: | Credit Card Processing System Activity Diagram |
| UML Diagram: | Activity Diagram |
| Users: | Bank Admin or Crews, and Credit Card Applicants |
| Tools Used: | Diagram tools that provide activity diagram symbols. |
| Designer: | ITSourceCode.com |
What is Credit Card Processing System?
Credit card processing is a multi-step process that is required to correctly complete credit card payments. In today’s digital age, transactions can take place in person, online, over the phone, or through the mail.
A credit card processing system is software that provides aid in a complicated business. It includes many functions such as new technology, payment networks, regulatory authorities, and financial institutions. Credit card processors, like any service involving that level of sophistication, sometimes vary in quality.
Define the Activity Diagram
An activity diagram is a type of UML that is known as a behavior diagram. This diagram shows the flow of interaction between the system and clients. This is done by helping them visualize the system’s functionality in various degrees of detail.
The activity diagram in UML describes the processes in a use case diagram. Its’ illustration can also be sequential or concurrent. It is one of the Credit Card Processing System UML diagrams.
Credit Card Processing System Activity Diagram
The activity diagram example expands the system’s concepts. It is shown in the detailed illustration to enlighten the programmers.
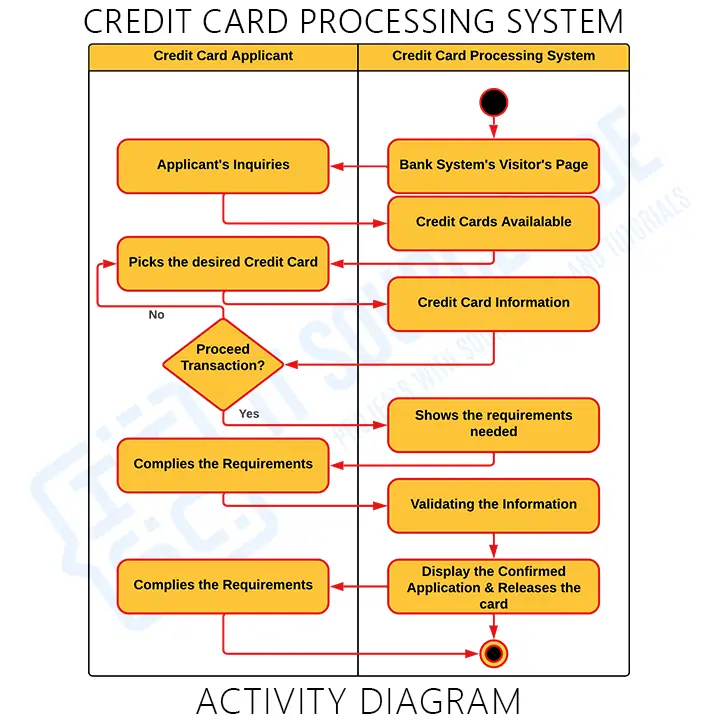
As seen in the illustration, we used the swimlane with three partitions. The left partition of the diagram shows the applicant lane. It covers all the possible activities and scope of an applicant when using the system.
Now, the system’s scope and activities were placed in the right lane. This is to show that the system acts as the actor that processes the applicant’s activities. Therefore, the system is accessible to the applicant.
To access the system, the applicant must have their accounts logged into the software. The functions were then emphasized as the activities flow and the system and users communicate.
You can add more to this and it is up to you how will you create your activity diagram. But, make sure that you have precise information and include the important decisions (actions).
Downloadable PDF File
How to Draw an Activity Diagram?
Time needed: 5 minutes
Here are the steps in developing (designing) the activity diagram for credit card processing system.
- Step 1: Familiarize Activity Diagram Symbols
To draw an activity diagram, you need to familiarize yourself first with the symbols used. The symbols let you discuss the system’s flow of activities and interaction.
- Step 2: Identify the flow of actions.
After knowing the symbols used, you will need to identify the flow of actions. The flow of actions would be based on your use case diagram.
Actions describe the series of activities when a user invokes the card processing.
- Step 3: Add the Actors (users) involved.
Actors carry out their actions on things, transforming them into other objects or changing their state. This actor is someone or something that interacts with the system.
- Step 4: Trace the flow of activities.
To make a flow or path for activities, make sure you know that the flows can be sequential, branching, or run.
Conclusion:
In conclusion, we have learned What is an activity diagram for credit card processing system and the steps. This diagram acts as one of the methodologies for creating the system.
Therefore, using an activity diagram in UML will not only let you understand the project but also tell you its benefits. This diagram works best with the other UML Diagrams.
Related Articles:
Inquiries
If you have inquiries or suggestions about the given example Credit Card Processing System Activity Diagram, just leave us your comments below. We would be glad to hear to concerns and suggestions and be part of your learning.
How to read an activity diagram
An activity diagram is essentially a flowchart with UML notation. It shows the sequence of actions in a process or use case.
- Initial node. Filled black circle marks the start.
- Activity/Action. Rounded rectangle for a step.
- Decision node. Diamond with a guard condition on each outgoing arrow.
- Merge node. Diamond joining multiple flows back into one.
- Fork. Horizontal bar splitting one flow into parallel flows.
- Join. Horizontal bar merging parallel flows back into one.
- Final node. Circle with a filled dot inside.
- Swimlanes. Vertical columns showing which actor performs each action.
Common capstone mistakes
- Decision without guard condition. Every branch needs a bracketed condition.
- Missing merge nodes. When branches rejoin, use a merge diamond.
- Fork/join mismatch. Every fork must have a matching join.
- No swimlanes. Multi-actor processes benefit from swimlanes.
Where the activity diagram fits
- Section 3.3 (Process Design).
- One diagram per major workflow.
Official documentation
Working source code for this system
Download the actual implementation of this system in your preferred language. Each project includes source code, database, and setup instructions for BSIT capstone use.
- PHP: [Complete] Online Food Ordering System In CodeIgniter
- VB.NET: Job Ordering System with Sales and Inventory in Vb.net
- Python: Order Management System Project in Django with Source Code
- Django: Order Management System Project in Django with Source Code
- CodeIgniter: [Complete] Online Food Ordering System In CodeIgniter
- ASP.NET: Online Food Ordering System Project in ASP.net FREE Download
Frequently asked questions
What is a activity diagram used for in BSIT capstone?
An activity diagram shows the workflow or business logic: activities, decisions, forks, and joins in a process. It communicates the sequence of steps for a specific operation and is placed in Chapter 3.
What tool should I use to draw the activity diagram?
Free options: draw.io (browser-based, saves to Google Drive), Lucidchart free tier, PlantUML (text-based, version-controllable), StarUML (30-day trial then reduced feature set), Visual Paradigm Community Edition. Paid options: Microsoft Visio, Lucidchart pro, Enterprise Architect. For BSIT capstones, draw.io is the most commonly used free tool.
How detailed does the activity diagram need to be for capstone defense?
Panel members expect the diagram to match the actual system implementation. Include every major class/use case/entity relevant to the system. Omit trivial helper classes. Every diagram element should have a clear justification. Aim for 1-2 diagrams that fully cover the system, not many partial ones.
Should I use black-and-white or colored diagrams?
Black-and-white is standard for capstone documentation to match the thesis format. Use color only if it improves clarity (e.g., grouping subsystems). Ensure text is readable at printed size (10pt minimum for labels).
Where does this diagram go in the capstone documentation?
Chapter 3 (System Design and Methodology) typically holds all UML diagrams. Introduce each diagram with a 1-paragraph description explaining what it shows and how to read it. Reference specific elements in the surrounding text so panel members can follow the design rationale.

Mary Grace G. Patulada
Programmer & Technical Writer at PIES IT Solution
Mary Grace G. Patulada (pen name ‘Nym’) is a programmer and writer at PIES IT Solution with a BSIT background from Carlos Hilado Memorial State College, Binalbagan Campus. Authored 370+ UML diagram tutorials and capstone documentation guides at itsourcecode.com. Specializes in UML (class, use case, activity, sequence, component, deployment), DFD, and ER diagrams for BSIT capstone projects.
Expertise: UML Diagrams · DFD · ER Diagrams · Use Case Diagrams · Activity Diagrams · Capstone Documentation · PHP
· View all posts by Mary Grace G. Patulada →