

The activity diagram for online railway reservation system is a UML activity diagram built to give the developer the right ideas on how to develop the said software with an explanation.
When designing this system activity diagram, you must show the flow of activities that are done in making railway reservations.
What is a Railway Reservation System Activity Diagram?
The Railway Reservation System Activity Diagram diagram is used to help developers, readers, and users to understand how the software should behave once it is used.
Moreover, the activity diagram shows the core of the system along with symbols like actors, swimlanes, and arrows.
The users of this railway reservation system would be online railway passengers or customers. Hence, it should be determined first in making an activity diagram.
Wherein it serves as actors who will use the system and then proceeds in designing a series of activities or reservation processes that happen on the system.
Purpose of Activity Diagram
The Railway Reservation System must have an activity diagram so that programmers could understand how the software should interact with its users.
Particularly, the activity diagram guides the programmer in creating the software and its must-have behavior. So if you want friendly and effective or easy-to-use software, then you must also complete the activity diagram.
Through the activity diagram, you’ll be able to illustrate the flow of activities and know what should be the interactions between the system and its users.
The activity diagram will also help your readers and users understand how to use the system. So it is best for you to explain your thoughts regarding with system through an activity diagram.
Activity Diagram Symbols:
Before we create the activity diagram of the system, we must know first the symbols used to create it.
Here are the symbols used in the activity diagram.
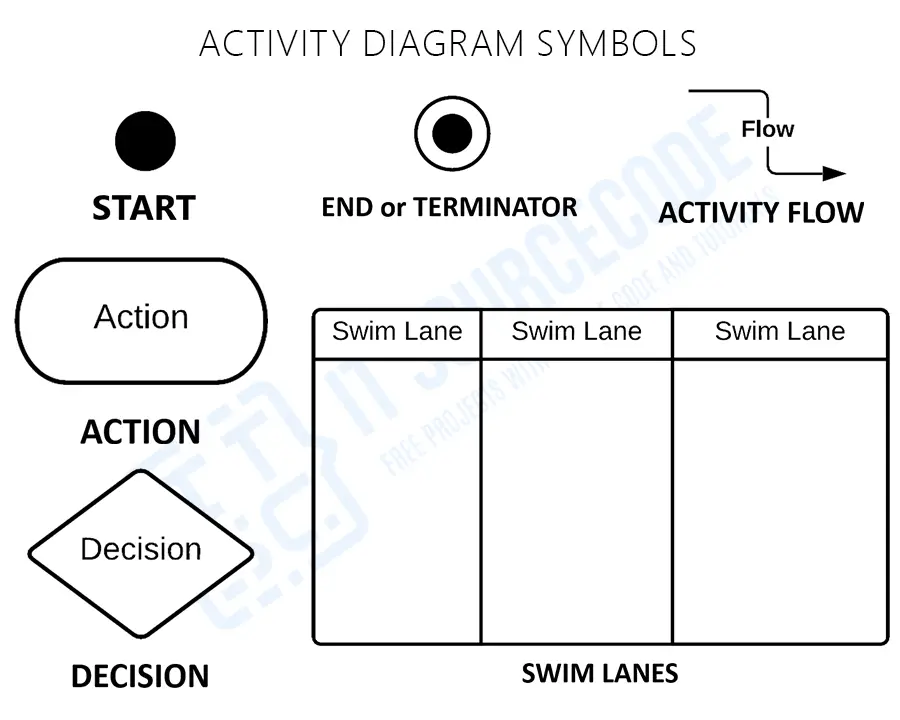
We must be familiar with these symbols in order for you to distinguish what should go in the illustration to avoid misunderstandings. This is also to familiarize with the activity diagram used thus the users will understand the system’s behavior.
Activity Diagram of Railway Reservation System
The activity diagram for the Railway Reservation System gives an explanation of the general flow of activities when doing a railway ticket reservation online.
Now, to make this kind of diagram, you have to figure out the processes, the people who will use it, and the way it will work.
The following are activities we can consider in the system:
- The customer will invoke the system, then the system caters to the customer’s request.
- The customer will request to avail a reservation for the railway, so the system will then check if there’s still a reservation available.
- Then the customer will process the reservation.
- The railway crew or admin will confirm the reservation.
Here is the example design of the Railway Reservation System activity diagram:
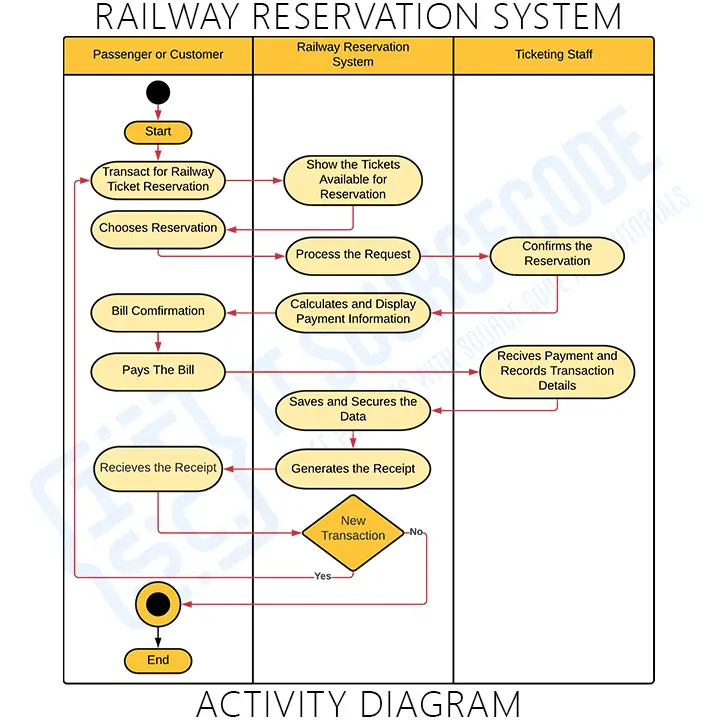
Note: The ideas given in this activity diagram to meet the scope of the railway reservation system project can be changed depend on what you desire. The given ideas here are sorted based on the system users to give you more detailed examples.
Conclusion
In conclusion, it is essential for you to know the explanation of the diagrams used to design and develop the railway reservation system. This is due to the fact that, without it, it is impossible to create a fully functional system.
But before you create this activity diagram, you will know first the possible inputs and scenarios that the system should process and perform. You will also figure out what business processes are needed and link them to the UML diagrams.
By filling out the Activity Diagrams for each module or process, you will easily get to the system you want.
Related Articles
- Online Railway Reservation System UML Diagrams
- Deployment Diagram for Railway Reservation System
- Railway Reservation System Sequence Diagram
Inquiries
Now, what have you learned through our discussion? Have you determined the diagrams that you must create? What project do you have in mind?
And, if you have any suggestions or questions about our discussion, please leave them in the comments section. Your thoughts are highly appreciated. Thank you so much and have a good day!
Check out our related and recommended articles for more learning and information.
How to read an activity diagram
An activity diagram is essentially a flowchart with UML notation. It shows the sequence of actions in a process or use case.
- Initial node. Filled black circle marks the start.
- Activity/Action. Rounded rectangle for a step.
- Decision node. Diamond with a guard condition on each outgoing arrow (e.g., [amount > 100]).
- Merge node. Diamond joining multiple flows back into one.
- Fork. Horizontal bar splitting one flow into parallel flows.
- Join. Horizontal bar merging parallel flows back into one.
- Final node. Circle with a filled dot inside — end of the activity.
- Swimlanes. Vertical columns showing which actor performs each action.
Common capstone mistakes to avoid
- Decision without guard condition. Every branch from a decision must have a condition in brackets.
- Missing merge nodes. When branches rejoin, use a merge diamond, not just connect the lines.
- Fork/join mismatch. Every fork must have a matching join.
- No swimlanes. Multi-actor processes benefit greatly from swimlanes for clarity.
- Too detailed. Focus on business logic, not UI clicks.
Where the activity diagram fits in Chapter 3
- Section 3.3 (Process Design). Ideal for business workflows.
- One diagram per major use case or workflow.
- Reference from the use case description so panel can trace the flow.
Official documentation
Working source code for this system
Download the actual implementation of this system in your preferred language. Each project includes source code, database, and setup instructions for BSIT capstone use.
Frequently asked questions
What is a activity diagram used for in BSIT capstone?
An activity diagram shows the workflow or business logic: activities, decisions, forks, and joins in a process. It communicates the sequence of steps for a specific operation and is placed in Chapter 3.
What tool should I use to draw the activity diagram?
Free options: draw.io (browser-based, saves to Google Drive), Lucidchart free tier, PlantUML (text-based, version-controllable), StarUML (30-day trial then reduced feature set), Visual Paradigm Community Edition. Paid options: Microsoft Visio, Lucidchart pro, Enterprise Architect. For BSIT capstones, draw.io is the most commonly used free tool.
How detailed does the activity diagram need to be for capstone defense?
Panel members expect the diagram to match the actual system implementation. Include every major class/use case/entity relevant to the system. Omit trivial helper classes. Every diagram element should have a clear justification. Aim for 1-2 diagrams that fully cover the system, not many partial ones.
Should I use black-and-white or colored diagrams?
Black-and-white is standard for capstone documentation to match the thesis format. Use color only if it improves clarity (e.g., grouping subsystems). Ensure text is readable at printed size (10pt minimum for labels).
Where does this diagram go in the capstone documentation?
Chapter 3 (System Design and Methodology) typically holds all UML diagrams. Introduce each diagram with a 1-paragraph description explaining what it shows and how to read it. Reference specific elements in the surrounding text so panel members can follow the design rationale.

Mary Grace G. Patulada
Programmer & Technical Writer at PIES IT Solution
Mary Grace G. Patulada (pen name ‘Nym’) is a programmer and writer at PIES IT Solution with a BSIT background from Carlos Hilado Memorial State College, Binalbagan Campus. Authored 370+ UML diagram tutorials and capstone documentation guides at itsourcecode.com. Specializes in UML (class, use case, activity, sequence, component, deployment), DFD, and ER diagrams for BSIT capstone projects.
Expertise: UML Diagrams · DFD · ER Diagrams · Use Case Diagrams · Activity Diagrams · Capstone Documentation · PHP
· View all posts by Mary Grace G. Patulada →