The Data Flow Diagram (DFD) depicts the data flow and transformations that occur when data enters and exits a system. This DFD represents and describes the inventory management system as a whole, including input, processing, and output.
The inventory management system DFD consists of DFD levels 0, 1, and 2. It also uses entities, processes, and data to define the whole system.
0 Level DFD for Inventory Management System
The parameters of the inventory management system are specified in a context diagram (level 0 data-flow diagram). It illustrates how information moves between the system and its external entities.
Through DFD level 0, the entire concept of the system is demonstrated in a single process. For example:

The diagram’s arrows show the direction in which the data input flowed. The major function is labeled as the “inventory management system,” and its name sparks the discussion under it.
The external entities that cause the system to perform a certain function are as follows:
- Customers
- System Admin
As a result, the following illustrations begin at the system’s DFD level 0.
Level 1 DFD for Inventory Management System
The first level DFD of the inventory management system describes each of the system’s primary sub-processes. This level represents the context diagram’s “extended viewpoint.”

The given example reveals the sub-processes under inventory management. Each of them complements in showing how exactly the inventory management system works. The sub-processes are:
- Manage Customer Information
- Manage Sales Information
- Manage Stocks
- Manage Transaction and Payments
The process of managing customer information includes the gathering of the customer’s basic data. This data is used for transactions, purchasing, and inventory purposes.
Now, the system also has to keep track and manage the business sales, which happens when a customer buys something from the store through the system.
In the case of inventories, the system possesses an algorithm that automatically monitors and manages stocks for the establishment. This enables the admin (owner) to manage the business efficiently. Its management will be based on the count of products and purchasing inputs.
The system also manages the transactions and payments of each customer to complete the overall function. Then the transactions were saved in the database for inventory purposes.
Be aware that the basis for these concepts comes from the basic activities associated with managing practical inventories. The suggested idea can be used as is or altered to serve your intended purpose.
You can stop working at this point because you already understand how the project will function overall. The next level, though, might pique your interest due to what it is and how it functions.
DFD Level 2 for Inventory Management System
Among the preceding levels, DFD level 2 has the highest concept abstraction. The reason for this is that this level describes the processes (if any) that fall under the level 1 sub-process.
At this point, let’s focus on a crucial aspect of the data flow diagram.
For example, Databases
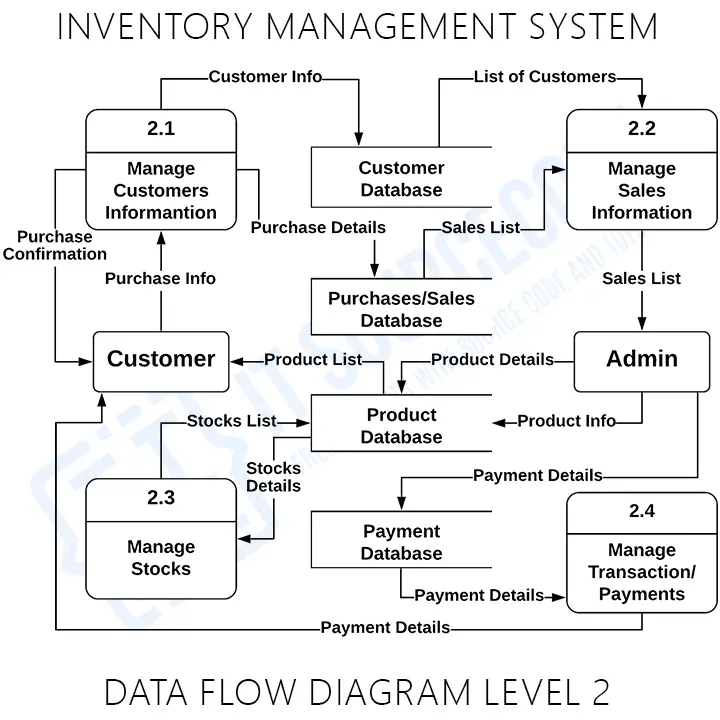
The example is supposed to clarify one of level 1’s sub-processes. Instead, the system’s database (data store) is highlighted more.
The databases of the inventory management system are composed of:
- Customer Database
- Purchases and Sales Database
- Product Database
- Payment Database
These data repositories are responsible for maintaining data security and accessibility. The system will only provide information to the user who requested it.
Remember
The explanation of the listed DFD levels changes based on the needs of your project or your client’s preferences. However, the explanation must make apparent the primary function of the system as well as its sub-processes and databases.
The DFD level 0 (context diagram) should emphasize the primary system process.
The DFD level 1 must provide additional detail on the subprocesses of the primary process.
DFD level 2 is the highest level of the project, hence it is the most thorough of the three diagrams. However, this level specifies simply a subsystem or subprocess from DFD level 1. When all parts of a project must be specified, DFD level 2 can be represented by many diagrams.
Inventory Management System Data Flow Diagram Pdf
You may download the Data Flow Diagram for Inventory Management System PDF by clicking the button below. It has the full details and discussion of the System’s Data Flow Diagram.
You can also modify its content to complete your project requirements and needs.
Data Flow Diagram Symbols
To build these levels, the data flow diagram uses defined symbols to represent the overall project. The DFD symbols are as follows:
| Name | Symbol | Meaning |
| External Entities | 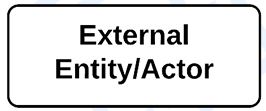 | The places where data comes into and goes out of the system are called “External Entities.” Entities are referred to by numerous names, including actors, terminators, sources, and links. |
| Process | 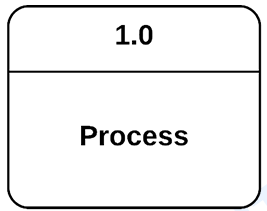 | The process is the part of DFD that is in charge of processing the data and producing output from it. |
| Data Store | A data store also called a database, is a table that stores files and other resources for potential future use. | |
| Data Flow |  | Data flow is the transfer of information between different external organizations, processes, and data stores. |
The symbols of the data flow diagram help in discussing the project’s function. Readers and developers could understand the system’s function through diagrams than paragraphs.
Let us discuss some of the advantages of using a Data Flow Diagram.
- It is a representation that aids in the visualization of system contents.
- This diagram is included in the system documentation file.
- It is simple to grasp and understand by both programmers and users.
- System components were detailed and explained in DFD diagrams.
- It also aids in comprehending a system’s operation and limitations.
Working source code for this system
Download the actual implementation of this system in your preferred language. Each project includes source code, database, and setup instructions for BSIT capstone use.
- PHP: Stock Management System in PHP with Source Code
- VB.NET: Sales and Inventory Management System Project in VB.Net Source Code
- Java: Stock Management System Project in Java with Source Code
- Python: Django Warehouse Management System with Source Code
- Django: Django Warehouse Management System with Source Code
- Laravel: Inventory Management System in Laravel With Source Code
Frequently Asked Questions
Official documentation
Recommended books to master UML and DFD for capstone
The links below are affiliate links. We may earn a commission at no extra cost to you when you buy or sign up. See our affiliate disclosure.
What is a DFD for Inventory Management System?
A Data Flow Diagram (DFD) for Inventory Management System is a UML diagram showing how product, stock, supplier, sales, and purchase data flows through the inventory tracking system. It documents processes like adding products, updating stock levels, processing orders, managing suppliers, and generating reports , essential for retail and warehouse capstone projects.
What are the three levels of Inventory Management DFD?
Inventory Management System DFD has three levels. Level 0 (Context) shows the system with external entities: Admin, Supplier, Sales Staff, Manager. Level 1 details main processes: Product Management, Stock Management, Purchase Management, Sales Management, Reports. Level 2 expands each , for example, Stock Management into stock-in, stock-out, stock adjustment, and low-stock alerts.
What external entities are in Inventory Management DFD?
External entities in Inventory Management System DFD are: Admin (system configuration, user management), Manager (views reports, makes decisions), Sales Staff (records sales, checks stock), Warehouse Staff (receives goods, updates stock), Supplier (provides products, receives orders), and Customer (places orders for stock outflow). Each entity interacts with specific processes in the system.
What data stores are needed in Inventory DFD?
Inventory Management DFD includes these data stores: D1 Products (product_id, name, category, price), D2 Stock (current quantity, reorder level, location), D3 Suppliers (supplier info, products supplied), D4 Purchase Orders (order details, expected delivery), D5 Sales (transaction records, customer info), D6 Returns (return records, reasons), D7 Categories, and D8 Reports (auto-generated analytics).
How are low-stock alerts shown in Inventory DFD?
Low-stock alerts in Inventory Management DFD are shown as: a process in Level 2 (under Stock Management) that monitors stock levels, compares current quantity with reorder_level for each product, triggers alert when stock < reorder_level, sends notification to Manager or Admin (external entity), and optionally auto-generates purchase order to Supplier. This is critical for preventing stockouts.
Conclusion
We have now discussed the significance of creating levels 0, 1, and 2 of the data flow diagram (DFD) for the inventory management system. Neither of the three levels is the lowest nor the greatest, but their roles work together to create the entire data flow in the system.

Mary Grace G. Patulada
Programmer & Technical Writer at PIES IT Solution
Mary Grace G. Patulada (pen name 'Nym') is a programmer and writer at PIES IT Solution with a BSIT background from Carlos Hilado Memorial State College, Binalbagan Campus. Authored 370+ UML diagram tutorials and capstone documentation guides at itsourcecode.com. Specializes in UML (class, use case, activity, sequence, component, deployment), DFD, and ER diagrams for BSIT capstone projects.
Expertise: UML Diagrams · DFD · ER Diagrams · Use Case Diagrams · Activity Diagrams · Capstone Documentation · PHP
· View all posts by Mary Grace G. Patulada →