
The Data Flow Diagram (DFD) for the College Management System shows the overall flow of data through the system.
Its main focus is to describe how the data moves in and out of the system.
The DFD diagram has three main levels:
- Level 0 (Context Diagram)
- Level 1
- Level 2
0 Level DFD – College Management System
The DFD level 0 (context diagram) portrays the systems’ abstract view or the single process with its external parties.
It depicts the overall structure as a single bubble that comes with incoming and outgoing indicators showing input and output data.
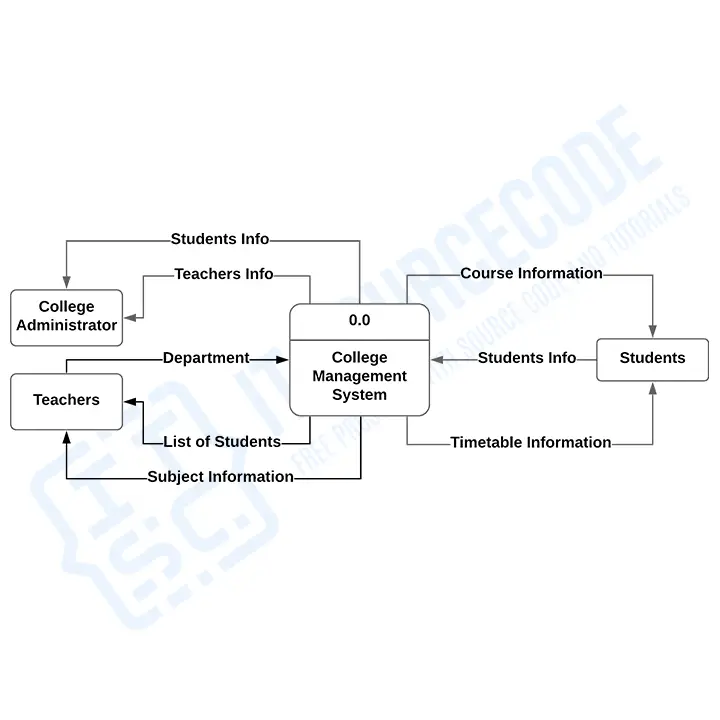
This diagram serves as the main idea that reveals the main process, users, and data that roam the system.
The college system’s external entities are as follows:
- College Administrator
- Teachers
- Students
1 Level DFD – College Management System
The context diagram is used to derive the DFD Level 1 content, which is then split down into sub-processes.
This is to inform the programmer about the system’s included operations and data inputs.
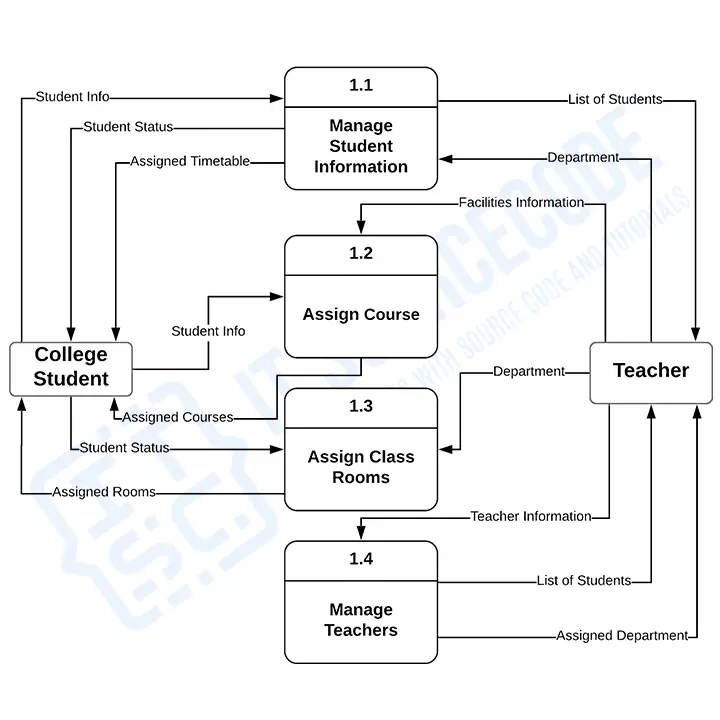
The illustration demonstrates that the data processing and flow expand while the external entities remain unchanged. When the project was completed, the revealed external entities were the intended users.
The 1st level of the college management system DFD is composed of the following sub-processes:
- Manage Student Information
- Assign Courses
- Assign class Rooms
- Manage Teachers
In addition to knowing the general context words, you will also be familiar with DFD level 1. This is also a reference to how the system manages the college management system’s inputs or data.
You will also be informed of the outcomes the system generates.
Remember: These procedures are all based on the College Management System notion.
2 Level DFD – College Management System
DFD level 2 describes where data inputs are routed and where they originate inside the project.
Once you know how to use a data flow diagram, you can figure out how important it is to break down operations in more detail.
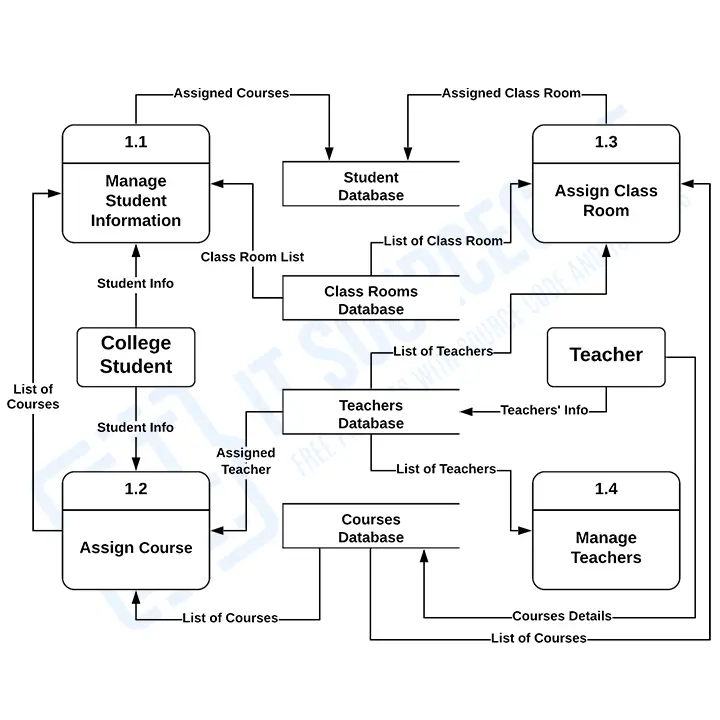
Level 2 is the most abstract level of the data flow diagram for the college administration system. Also emphasized is data management, including data storage (database). Databases were responsible for storing the data that entered the system and serving as the source of data outputs.
Know more about the college system’s databases through the College Management System Project Entity Relationship Diagram.
The system’s database (data store) includes the following:
- Student Database
- Class Rooms Database
- Teachers Database
- Courses Database
DFD level 2 does not only reveal the system analysis and design but also reveals the precise destination of data that passes through the system.
As can be seen, as the levels of data flow diagrams are constructed, the relationships between the transactions and data expand and get more explicit.
Note: The last level (DFD level 2) is not required all the time. It is only needed when more of the included sub-processes need to be talked about.
Moreover, everything in the Data Flow Diagram is based on the idea of the College Management System.
In addition, you can use these DFD diagrams as guides while creating your college management system at DFD levels 0, 1, and 2.
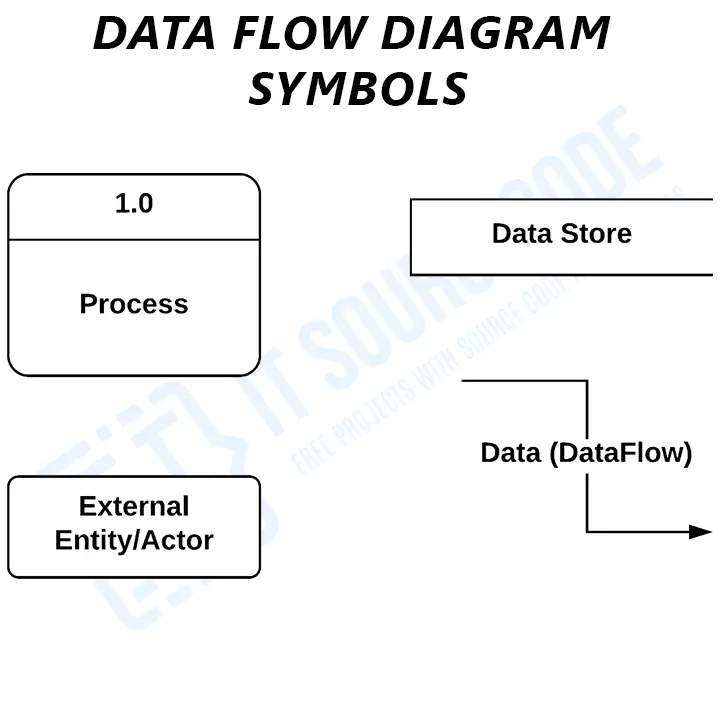
Data Flow Diagram Symbols
- External Entities
- Process
- Data Store
- Data Flow
External entities are the points at which data enters and exits the system. Terminators, sources, sinks, and actors are examples of entities.
The process is the section of DFD that modifies and outputs data.
A data store (database) is a table where files or repositories are stored for later use.
Data flow refers to the movement of information between external entities, processes, and data repositories.
Conclusion
The College Management System Data Flow Diagram levels have their roles in emphasizing the data flow.
The Level 0 or Context Diagram presents the single and main process of the college management system as well as the main users and the data.
Then, the DFD levels 1 and 2 explain exactly how the system’s processes, subprocesses, and data movements work.
Very Nice Blog. Thanks For Sharing This Article Here I am Sharing Some Information About Our Software Services
Campus Management System in Malaysia