
In this article, you will learn how to use an Arduino Water level sensor and plot the data in Python.
Creating this project will let you do serial communication from Arduino to Python.
This is very useful if you are gathering data live or constantly monitoring liquids.
Arduino Water Level Sensor with Python Live Data Plotting: Creating the Device
Here are the steps in interfacing the sound module in Arduino.
- Gathering the Components
The first thing to do is to collect the hardware components for the Arduino device.
Arduino Uno
Water Level Sensor - Connecting the Components
Connect the components to the Arduino Uno. Please refer to the wiring diagram below.
- Coding the Arduino
Third step is about coding the Arduino device.
- Upload the Sketch
After coding the Arduino, upload the sketch.
- Coding with Python
Next is to create a project in Python and write codes that will read the serial monitor of the Arduino, save it in a CSV file, and plot it on a graph.
Arduino Water Level Sensor with Python Live Data Plotting: Detailed Explanation
To start this project, you need the following:
| Qty | Component |
| 1 | Arduino UNO |
| 1 | Water Level Sensor |
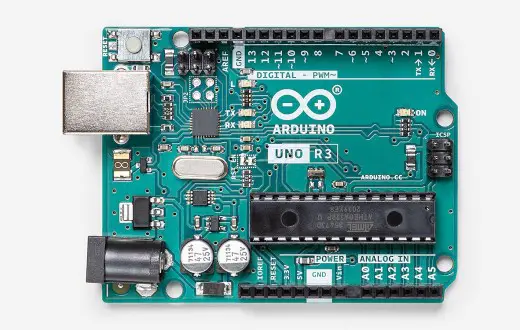
Arduino UNO
We will be using an Arduino Uno microprocessor board. Arduino Uno is suitable for any projects and is the cheapest and widely used microprocessor board in the Arduino family. This is great for all kinds of IoT projects.
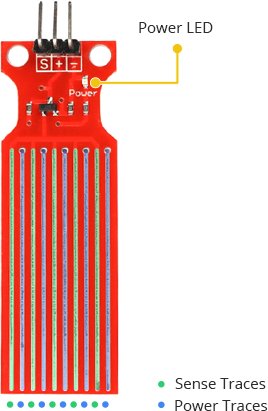
Water Level Sensor
Below is a Water level Sensor. It has 3 pins for Power, Ground, and Signal. Also, it has a Power LED indicator.
The sensor gives a signal when the exposed parallel conductors are submerged into a liquid. The more it is submerged, the greater the data signal value.
Keep in mind that the range of the value is based on the liquid. Better test it on the intended liquid you are planning to use it.
A warning – you have to be careful when handling the sensor though.
You can only submerge the sensor up to exposed conductors. Also, you cannot submerge it in a long period of time.
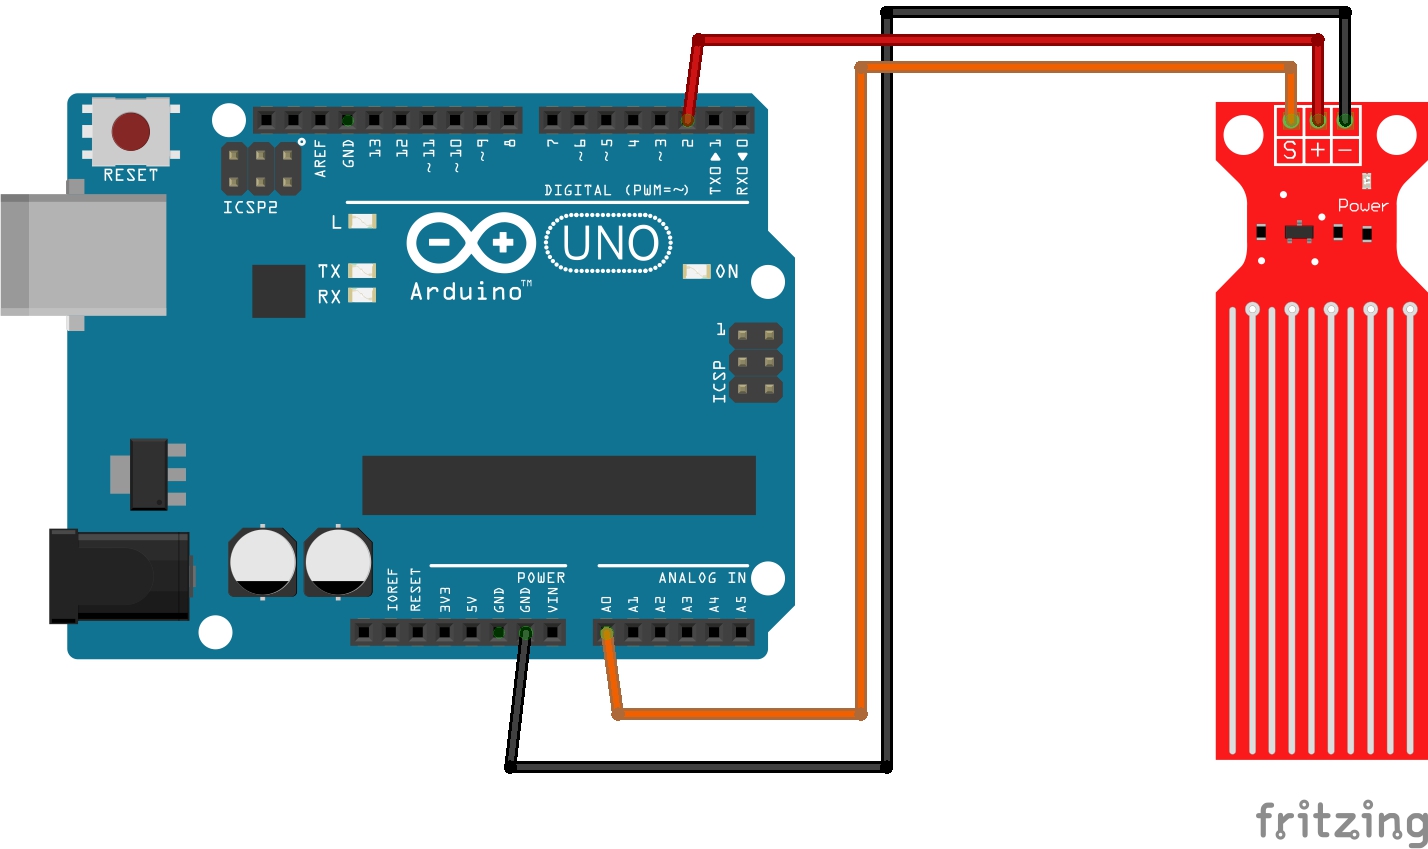
Wiring Diagram
For the wiring, you just need to connect the Signal to an Analog pin and the Ground to the Ground pin. To power it though you need it to connect it to a Digital pin.
Digital pins can also power sensors and in this case, it is used to power the sensor to help with the longevity of the sensor.
Providing it with constant power (while constantly in contact with water) can destroy the sensor.
Arduino Water Level Sensor with Python Live Data Plotting: Arduino Code
For the code, you just need to allow the sensor to read every second and display it on the serial monitor. No texts or labels – just the value. Upload this to the Arduino board.
#define sensorPower 2
#define sensorPin A0

// Value for storing water level
int val = 0;

void setup() {
  // Set D7 as an OUTPUT
  pinMode(sensorPower, OUTPUT);

  // Set to LOW so no power flows through the sensor
  digitalWrite(sensorPower, LOW);

  Serial.begin(9600);
}

void loop() {
  //get the reading from the function below and print it
  int level = readSensor();

  Serial.println(level);

  delay(1000);
}

//This is a function used to get the reading
int readSensor() {
  digitalWrite(sensorPower, HIGH);  // Turn the sensor ON
  delay(10);              // wait 10 milliseconds
  val = analogRead(sensorPin);    // Read the analog value form sensor
  digitalWrite(sensorPower, LOW);   // Turn the sensor OFF
  return val;             // send current reading
}
Python Code
Now that our device is ready, you can now create live data plotting. First is to install pyserial and matplotlib.
Pyserial is the package that lets you communicate with the Arduino while the matplotlib creates the data plotting.
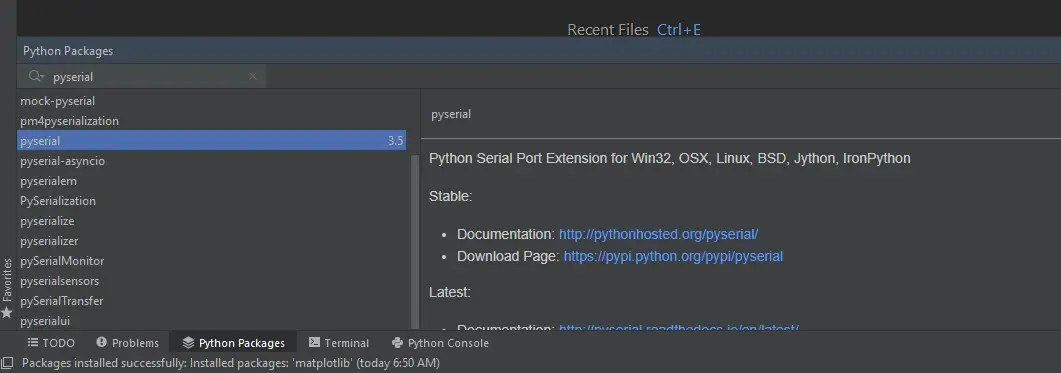
To do this, open PyCharm 2021 and go to View>Tool Windows, Python Packages.
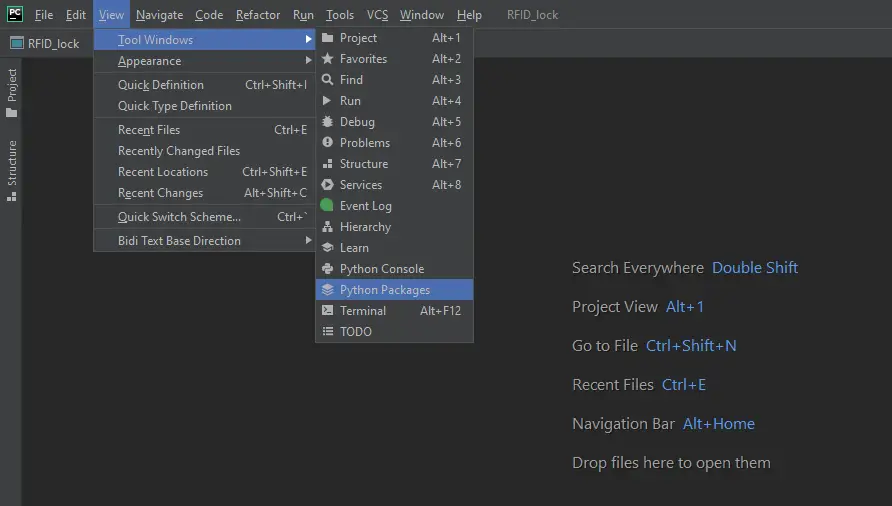
A window will appear below. search for pyserial and matplotlib. Click install and wait for it to finish. after that you are good to go.
Now create a new project in PyCharm and paste the code below.
import serial
import time
import csv
import matplotlib
matplotlib.use("tkAgg")
import matplotlib.pyplot as plt
import numpy as np
matplotlib.use("tkAgg")
if __name__ == '__main__':
ser = serial.Serial('COM5')
ser.flushInput()
plot_window = 20
y_var = np.array(np.zeros([plot_window]))
plt.ion()
fig, ax = plt.subplots()
line, = ax.plot(y_var)
while True:
try:
ser_bytes = ser.readline()
try:
decoded_bytes = float(ser_bytes[0:len(ser_bytes) - 2].decode("utf-8"))
print(decoded_bytes)
except:
continue
with open("test_data.csv", "a") as f:
writer = csv.writer(f, delimiter=",")
writer.writerow([time.time(), decoded_bytes])
y_var = np.append(y_var, decoded_bytes)
y_var = y_var[1:plot_window + 1]
line.set_ydata(y_var)
ax.relim()
ax.autoscale_view()
fig.canvas.draw()
fig.canvas.flush_events()
except:
print("Keyboard Interrupt")
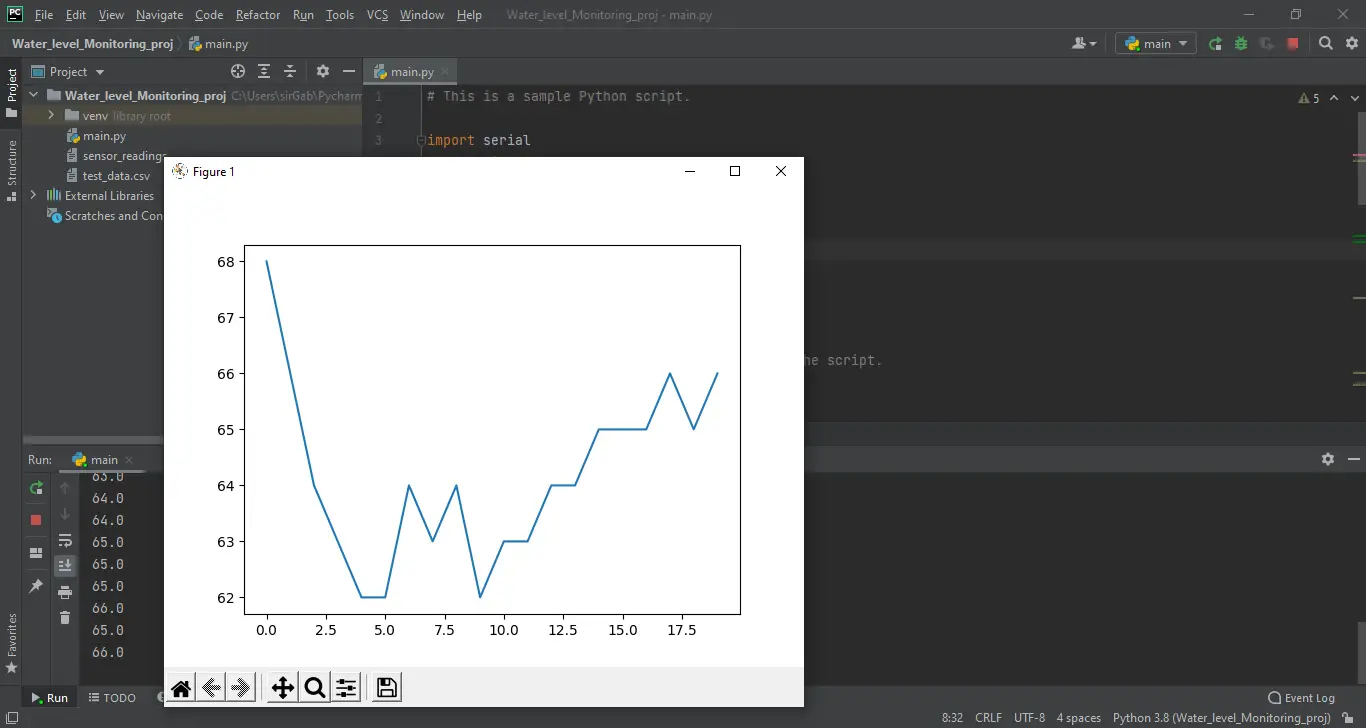
breakOutput
Now, run the program. Successful readings will result to a higher value while zero means the sensor is dry.
Summary
And that’s it! You have successfully created an Arduino Water Level Sensor with Python Live Data Plotting! All you need to do is code the sensor and assemble.
Then, create a project in Python and install Pyserial and Matplotlib packages, check the code above and run the program! This project is versatile and can be combined with other projects.
Download
Related Articles
Inquiries
Feel free to write your questions about the Arduino Water Level Sensor with Python Live Data Plotting at the comments below.