In this tutorial, we will explore the Excel Variance Function in depth. We will discuss the syntax and usage of the function, as well as the underlying mathematical concepts that make it possible.
We will also look at examples of how the Variance function can be used in real-world scenarios, such as in financial analysis and quality control.
Additionally, we will explore the relationship between the variance and other commonly used statistical measures, such as the standard deviation.
What is the variance function in excel
The Variance function in Excel is a powerful tool for analyzing and understanding the spread of a given set of data. This function calculates the variance, which is a measure of how far the individual data points in a set are from the mean of that set.
The variance is a key statistic in statistical analysis and is often used in conjunction with other measures such as the standard deviation to provide a comprehensive understanding of the distribution of a data set.
In Excel, the variance function is represented by the formula “VAR” and is used to calculate the variance of a set of data.
The syntax for the VAR function is as follows:
VAR(number1, [number2], ...)
Where:
- “number1” is the first number or cell reference in the set of data, and
- “number2” is the optional;
- (…)so on, are additional numbers or cell references to be included in the calculation.
For example, if you have a set of data in cells A2 to A10, you could use the formula “=VAR(A2:A10)” to calculate the variance of that data set.
Note: VAR.S is also available which calculates the sample variance and VAR.P which calculates the population variance.
How to calculate var in excel
To calculate variance in Excel, you can use the VAR or VAR.S function. The VAR function calculates the variance of a set of data, while the VAR.S function calculates the sample variance.
Here’s an example of how to use the VAR function:
=VAR(number1, [number2], …)
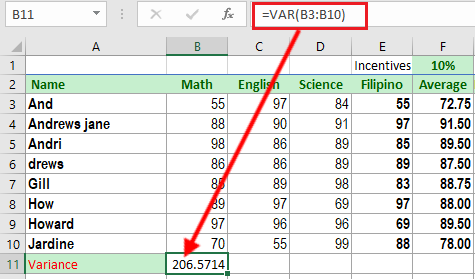
- Enter your data into a range of cells (for example, B2:B10).
- In an empty cell (for example, B11), type “=VAR(B3:B10)” and press Enter.
- Then the cell will display the variance of the data in the range B3:B10
Here’s an example of how to use the VAR.S function:
=VAR.S(number1, [number2], …)
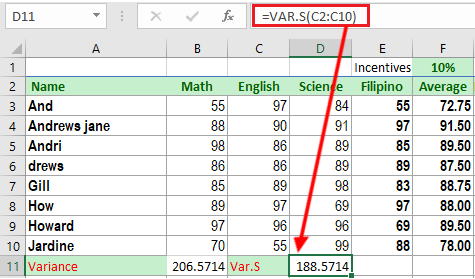
- Enter your data into a range of cells (for example, C2:C10).
- In an empty cell (for example, D11), type “=VAR.S(C2:C10)” and press Enter.
- The cell will display the sample variance of the data in the range C2:C10
Note: If you want to calculate population variance then you can use VAR.P instead of VAR.
Population Variance Formula
To calculate the population variance in Excel, you’ll need to use the following formula:
=VAR.P(number1, [number2], …)
This formula uses the built-in VAR.P function in Excel, which calculates the variance of an entire population based on the entire range of data you’ve selected.
For example, if you have a dataset with the following values: 5, 10, 15, 20, 25, 30, 35, 40, and 45, you would select the entire range of data and use the formula =VAR.P(A1:A9) to calculate the population variance.
Variance and standard deviation in excel
In Excel, the variance and standard deviation are related because the standard deviation is the square root of the variance.
The variance is a measure of the spread of a data set, and is calculated by taking the average of the squared difference of each data point from the mean.
Meanwhile, the standard deviation is a measure of the same spread, but is represented in the same units as the data, rather than squared units.
For example, in a set of data, the variance would be calculated as:
VAR(data) = (1/N)*((data1 - mean)^2 + (data2 - mean)^2 + ... + (dataN - mean)^2)
To get the standard deviation, we just need to take the square root of variance:
STDEV(data) = sqrt(VAR(data))
This makes it easy to go from one to the other in Excel.
For example, if you have calculated the variance using the VAR function, you can calculate the standard deviation by using the formula:
=SQRT(VAR(data))
Similarly, if you calculated the standard deviation using the STDEV function, you can calculate the variance by using the formula
=STDEV(data)^2
Let’s Wrap Up!
In this article, we have discussed the syntax and usage of the Variance function in Excel, as well as the underlying mathematical concepts that make it possible.
Overall, Excel the Variance function is an essential tool for anyone working with data. It allows for a quick and accurate calculation of the variance, providing valuable insights into the spread of a given data set.
By understanding the function and its applications, users can make informed decisions based on their data analysis.
Thank you for reading 🙂

Glay Eliver
Programmer & Technical Writer at PIES IT Solution
Glay Eliver is a programmer and writer at PIES IT Solution, author of over 600 tutorials at itsourcecode.com. Specializes in JavaScript tutorials, Microsoft Office how-tos (Excel, Word, PowerPoint), and Python error debugging covering ImportError, TypeError, AttributeError, ModuleNotFoundError, and JavaScript ReferenceError. Authored several of the site’s highest-traffic Excel and MS Office reference articles.
Expertise: JavaScript · MS Excel · MS Word · MS PowerPoint · Python · Python ImportError · Python TypeError · Python AttributeError · ModuleNotFoundError · JavaScript ReferenceError · Pygame · View all posts by Glay Eliver →