
This tutorial will explain how to calculate standard deviation using excel along with examples that will give more understanding, of this topic.
Excel is known and used in statistics and analysis of data other than that it is usually used in calculations. But before that let’s have a quick overview of what standard deviation is and how to use it.
What is Standard Deviation function?
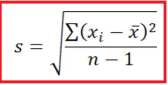
The standard deviation is a statistical measure of the variation of the set of data. In statistics, it is the distribution of dataset comparative to its mean. Further, it is the calculated square root of the variance.
Moreover, it’s very useful in how similar and dissimilar the data is. Besides, it’s not complicated and can be solved quickly if you’re familiar with the formula and commands.
Formula
=STDEV(number1,[number2],…)
The following explains the STDEV function arguments:
- number1(required argument)-This is the first number argument that is mandatory and corresponds to the population sample.
- number2(optional argument)-This is a numeric argument 2 to 255 that corresponds to a sample of a population
Reminder: This function had already have new more functions that provides accuracy and effectiveness of names reflect it usage. However it is atill available on older version for compatibility, hence I recommend to use new function for future purposes, specifically in lower versions of excel may not available.
Excel Standard Deviation Formula
The following are the six versions of standard deviation that will appear when you type =STDEV in a blank cell. Let’s familiarize them:
- STDEV.P: This standard deviation formula calculates the entire numeric information of the population. Thus ignores logical values and text in the worksheet.
- STDEV.S: This formula only calculates the sample standard deviation based on numeric information. It ignores the spreadsheet’s text and logical (TRUE or FALSE) values.
- STDEVA: Function calculates the sample standard deviation of a dataset and includes text and logical values in the calculation. All FALSE values are represented by 0, and TRUE values are represented by 1.
- STDEVPA: This formula calculates the standard deviation for an entire population and includes text and logical values in the calculation. Like STDEVA, all FALSE values are represented by 0, and TRUE values are represented by 1.
- STDEV: This is an older version of the STDEV.S formula that Excel used to find the standard deviation before 2007. It still exists for compatibility purposes.
- STDEVP: This is an older version of the STDEV.P formula that still exists for compatibility.
A lot of users use STDEV.S to accomplish their standard deviation calculations. Meanwhile, if you like to include logical conditions True or False for the entire population analysis, just select the most likely formula that matches the requirements.
How does excel calculate Standard Deviation?
Using the STDEV.S function
To repeat, STDEV.S calculates numerical values alone and ignores text and logical values.
Here is the syntax and equation of STDEV.S function.
=STDEV.S(number1,[number 2],…).
- number1. Required. The first number corresponds to the first element of the sample. Instead of arguments separated by commas, a named range, single array, or a reference to an array can be used here.
- number2. Optional. These can refer to a data point, a named range, a single array, or a reference to an array. Up to 254 additional arguments can be used
Suppose you have a data set as shown below:
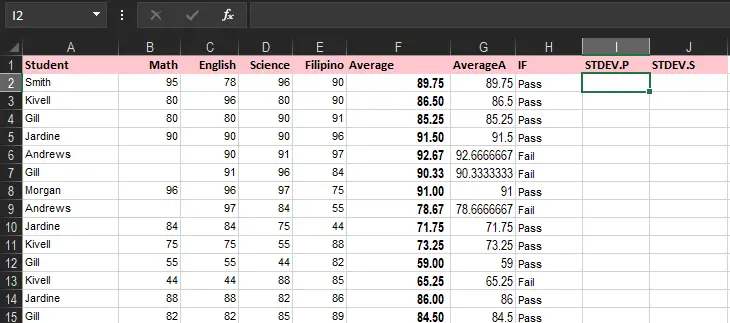
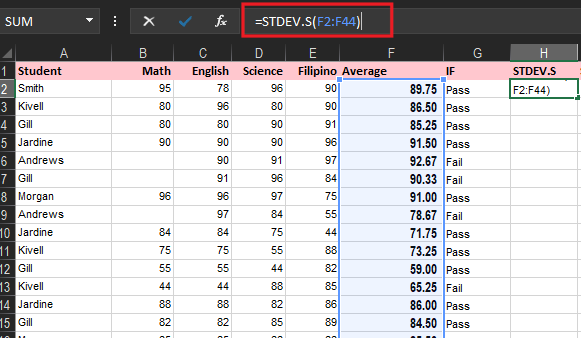
To calculate the standard deviation of sample size using this data set, use the following formula:
=STDEV.S(F2:F44)
In case you’re using Excel 2007 or prior versions, you will not have the STDEV.S function. In that case, you can use the formula below:
=STDEV(F2:F44)
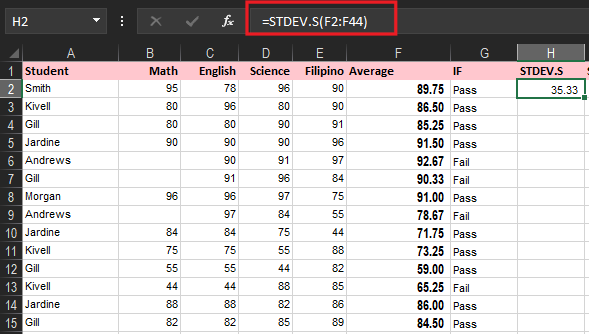
The above formula returns the value of 35.33, which indicates that most of the students in the class would be within the average range of 89.78-35.33 and 89.78+35.33.
Also, note that this is a very small sample size. In reality, you may have to do this for a bigger sample data set where you can observe normal distribution better.
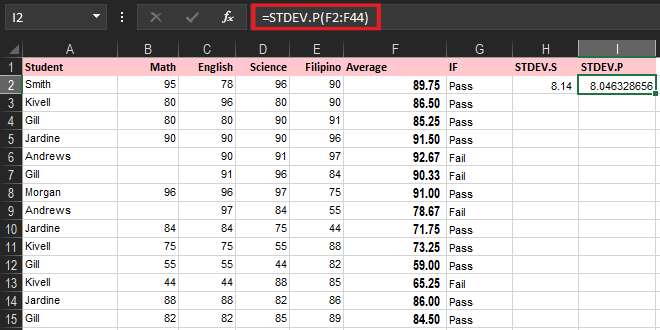
STDEV.P
The STDEV.P function (the P stands for Population) in Excel calculates the standard deviation based on the entire population.
For example, you’re teaching a group of 43 students. You have the test scores of all students. The entire population consists of 43 data points. The syntax will calculate the population using the stdev.p function.
Syntax
=STDEV.P(number1,[number2],…)
The STDEV.P function syntax has the following arguments:
- Number1 Required. The first number argument corresponds to a population.
- Number2, … Optional. Number arguments 2 to 254 corresponding to a population. You can also use a single array or a reference to an array instead of arguments separated by commas.
| Formula | Description | Result |
| =STDEV.P(F2:F44) | The standard deviation of student average, assuming only a total of 43 average. | 8.046328656 |
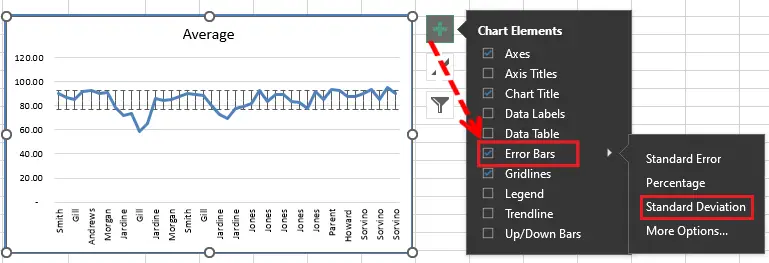
How to add Standard Deviation Error Bars in Excel
You can also display standard deviation bars in your Excel chart. Here are the steps:
- Create a graph in a typical way. Select Insert Tab>Chart Groups
- Click the Chart Element Button, to select the graph just click anywhere.
- Click the arrow next to Error Bars, and pick Standard Deviation.
This will display the same standard deviation bars for all data points.
Conclusion
Recap on this article, we learned how to calculate the standard deviation in excel, along with the various ways, formulas, and functionalities. You can choose the formula and calculate the standard deviation depending on your purpose.
Additionally, calculating the standard deviation presents the estimated values which deviate from the average. Hence its very helpful when data set is extensive.
I hope you will find this information helpful. Anyway, thank you for reading!

Glay Eliver
Programmer & Technical Writer at PIES IT Solution
Glay Eliver is a programmer and writer at PIES IT Solution, author of over 600 tutorials at itsourcecode.com. Specializes in JavaScript tutorials, Microsoft Office how-tos (Excel, Word, PowerPoint), and Python error debugging covering ImportError, TypeError, AttributeError, ModuleNotFoundError, and JavaScript ReferenceError. Authored several of the site’s highest-traffic Excel and MS Office reference articles.
Expertise: JavaScript · MS Excel · MS Word · MS PowerPoint · Python · Python ImportError · Python TypeError · Python AttributeError · ModuleNotFoundError · JavaScript ReferenceError · Pygame · View all posts by Glay Eliver →
thanks a lot and keep up the good work.