
The Online Hotel Reservation System ER Diagram is the project’s database design that reveals the relationships of the hotel reservation entities. This describes the logical structure of the system’s database or data storage. It is done by identifying the online hotel reservation process entities, their properties, and the interactions between them.
The database design is sketched out using online hotel reservation system project ER diagrams. This database sketch becomes the actual basis of the system’s data storage that will serve as data destination and source.
Online Hotel Reservation System ER Diagram: Details
The table shows the overall description of the ER Diagram for Online Hotel Reservation System. It has a complete overview of the project’s information.
| Name: | Online Hotel Reservation System ER Diagram |
| Abstract: | The online hotel reservation system ER diagram depicts the relationship between various entities. It can be thought of as a blueprint for your system (project) structure. |
| Diagram: | ER Diagram is also known as Entity Relationship Diagram |
| Tools Used: | Diagraming tools that provide ER diagram symbols. |
| Users: | Website, Applications, and Software. |
| Designer: | ITSourceCode.com |
What is Online Hotel Reservation System?
A hotel reservation system is a piece of software that allows clients to book directly with the hotel online. It enables guests to design their own vacation at their leisure.
It’s a software application that shows your live pricing and inventory across all of your channels in real-time. Allowing guests to choose their travel dates and complete their reservations.
What is an ER Diagram?
The ER Diagram is referred to as the hotel reservation system project database design. This ER diagram is the graphical depiction of relationships between all the entities involved in the system. Its major components are Entities, Attributes, and Relationships.
In DBMS, the online hotel reservation system ER Diagram is used to build and troubleshoot relational databases. It works best with DFD (Data Flow Diagram), which is responsible for data movement. Designing the hotel reservation system database would be much easier with the help of ER diagram.
This hotel reservation system ER diagram was based on a hotel reservation database design. The system’s function is to encode customer information and transaction.
Also, the hotel admin must have access to the customer information for reports and inventory purposes. The data used in these transactions must be managed and secured well. The use of ER Diagram for Hotel Reservation System is needed.
Importance of ER Diagram
The importance of ER diagram for online hotel reservation system is to help in modeling its data storage or database. It is the basis of the project’s database foundation for construction. This entity-relationship diagram (ERD) also aids in defining the data types to be stored such as their attributes and characteristics.
In addition to that, the ER Diagram also describes how an entity interacts with other entities. All other real-world projects are presented with ER Diagrams (database designs). To display the details and attributes of a data store.
The ER diagram for hotel reservation system is used in conjunction with its data flow diagram. They are very important in building a relational database because they let us visualize how data is connected generically.
Entity-relationship diagrams are utilized in software engineering during the planning phase of software development. It aids in the identification of various system constituents and their interrelationships. Hotel Reservation System ER Diagram is also used as the foundation of its DFD (Dataflow Diagram)
The database design for online Hotel Reservation System is the same as its ER diagram. They were used to emphasize the hotel reservation system database.
Data storage to determine the data to be stored and their attributes. This is to inform developers about the system’s structure in terms of data storing.
(ER) Diagram for Hotel Reservation System
The ER Diagram of Hotel Reservation System shows the included entities (data) and their supposed functions (attributes). Each of them was represented by a table to illustrate their characteristics and relationships with each other.
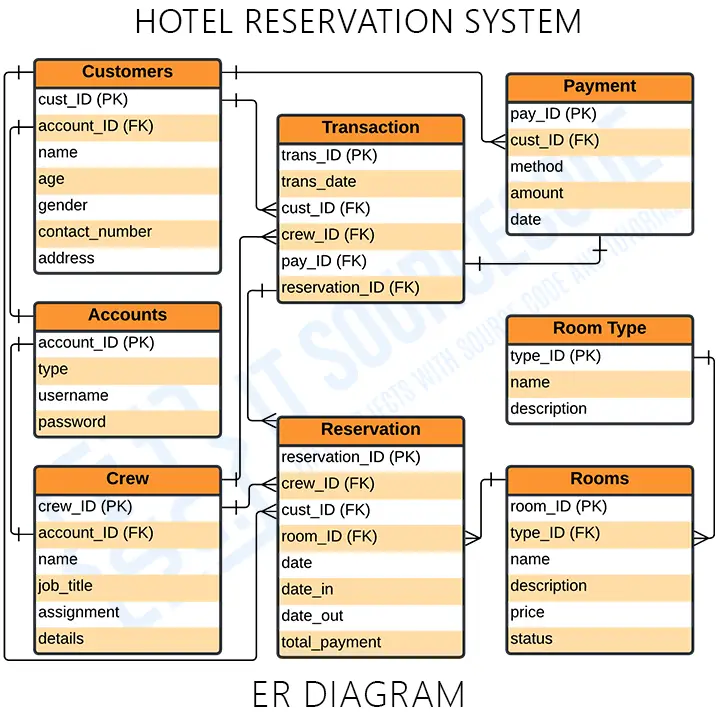
Based on the illustration given, you’ll be able to know the whole purpose of the database design of ER Diagram for Hotel Reservation System. That is to show the presence of a database to be used as the storage of all the data that enters the system.
As the source of all the output that the users require. That is how important the Database or the ER Diagram design for the Hotel Reservation System in DBMS function well.
Hotel Reservation System ER Diagram Tables
These tables below provide the complete database table details such as Field Name, Descriptions, data types, and character lengths. Each of these tables represents the characteristics and the attributes of data storage.
The field column presents the names of each database’s attributes. Description column gives the complete thought of each attribute. Type column is their data type and the length is for their character lengths.
Table Name: Accounts
| Field | Description | Type | Length |
| account_ID (PK) | Account ID | Int | 11 |
| type | Account Type | Varchar | 255 |
| username | Username | Varchar | 255 |
| password | Password | Varchar | 255 |
Table Name: Customer
| Field | Description | Type | Length |
| cust_ID (PK) | Customer ID | Int | 11 |
| account_ID (FK) | Account ID | Int | 11 |
| name | Customer Name | Varchar | 255 |
| age | Customer Age | Varchar | 255 |
| gender | Customer Gender | Varchar | 255 |
| contact_number | Contact Numer | Varchar | 255 |
| address | Customer Address | Text | 11 |
Table Name: Crew
| Field | Description | Type | Length |
| crew_ID (PK) | Crew ID | Int | 11 |
| account_ID (FK) | Account ID | Int | 11 |
| name | Crew Name | Varchar | 255 |
| job_title | Job Title | Varchar | 255 |
| assignment | Work Assignment | Varchar | 255 |
| details | Assignment Details | Text |
Table Name: Reservation
| Field | Description | Type | Length |
| reservation_ID (PK) | Reservation ID | Int | 11 |
| crew_ID (FK) | Crew ID (FK) | Int | 11 |
| cust_ID (FK) | Customer ID | Int | 11 |
| room_ID (FK) | Room ID | Int | 11 |
| date | Date of Reservation | Date | |
| date_in | Date of Coming In | Date | |
| date_out | Date of Coming Out | Date | |
| total_payment | Total Payment | Varchar | 255 |
Table Name: Room Type
| Field | Description | Type | Length |
| type_ID (PK) | Room Type ID | Int | 11 |
| name | Room Name | Varchar | 255 |
| description | Description | Text |
Table Name: Rooms
| Field | Description | Type | Length |
| room_ID (PK) | Room Class ID | Int | 11 |
| type_ID | Room Name | Varchar | 30 |
| price | Room Price | Int | 11 |
Table Name: Payment
| Field | Description | Type | Length |
| payment_ID (PK) | Payment ID | Int | 11 |
| cust_ID (FK) | Customer ID | Int | 11 |
| method | Payment Method | Varchar | 255 |
| date | Date of Payment | Date |
Table Name: Transaction
| Field | Description | Type | Length |
| trans_ID (PK) | Transaction ID | Int | 11 |
| tran_date | Transaction Name | Date | |
| cust_ID (FK) | Customer ID | Int | 11 |
| crew_ID (FK) | Employee ID | Int | 11 |
| pay_ID (FK) | Payment ID | Int | 11 |
| reservation_ID (FK) | Reservation ID | Int | 11 |
The tables given will be the basis for developers on how would they design the hotel reservation system database. It has the complete description of the database and they will put this into the program. The data storage the same as the names given to each of the tables. They will create a database with the attributes given as well as the value of each attribute.
How to create ER Diagram
Time needed: 5 minutes
Steps in building the ER Diagram for Hotel Reservation System with Cardinality Ratio.
- Step 1: Familiarize the ER Diagram (Entity Relationship Diagram) Symbols and Cardinality
Entity Relationship Diagram – shows the structure of data types in a project. It uses symbols to clarify its parts and relationships. Their symbols and applications must be familiarized before you build the ER Diagram.
ER Diagram Symbols:
• Fields: Fields are the parts of a table that define the entity’s characteristics. In the database that the ERD models, attributes are commonly thought of as rows.
• Keys is a technique to categorize data qualities. It is used to organize ER diagrams and assist users in modeling their databases to ensure that they are efficient. This is also used to connect different tables in a database.
– Primary Key: identifies a single entity instance which means a unique attribute or set of attributes.
– Foreign Key: is produced when data attributes have one too many relationships with other entities.
ER Diagram Cardinalities:
The styling of a line and its termination demonstrates cardinality and ordinality.
Cardinality is the most times one thing may be linked to another.
While Ordinality refers to the fewest number of times a single entity instance can be linked to another. - Step 2: Finalize the entities included
Start designing your ER Diagram by finalizing the entities that must be included in your bank reservation system. This entity is represented by a rectangle. And you’ll want to leave plenty of room for them in future phases so you may add them to your design.
An entity set is a group of similar entities with shared properties. A table or a table’s attribute is an entity in a database reservation system. As a result, by depicting relationships between tables and their characteristics. An ER diagram displays the whole logical structure of a database. - Step 3: Add the attributes of each entity
After finalizing the entities, think about the qualities you’ll need to characterize each entity. The details of the various entities outlined in a conceptual ER diagram are supplied as attributes. Characteristics of an entity, a many-to-many relationship, or a one-to-one relationship are all examples of attributes. Multivalued attributes can be assigned to several values.
The entity’s attributes were represented by ovals and can be seen in the tables of the bank reservation system ER diagram. These attributes can be a primary key or a foreign key in the database design of the project. Declaring the proper entities and their attributes can convert an ER diagram to a database. - Step 4: Describe the relationships (cardinality) between entities and attributes
To plot relationships between the ERD you will need the entities, their attributes, and relationships. You will base the data structure from the evaluated information to have the exact Entity Relationship Diagram.
A relationship is an association that describes how two entities interact. At the connector’s endpoints, the cardinality is indicated by a crow’s foot. One-to-one, one-to-many, and many-to-many are the three most common cardinal relationships. It’s the maximum number of times an instance of one entity can be linked to instances of another entity.
Conclusion
You need to know the diagrams used to design and develop the Hotel Reservation System. That is to help you create a fully-functional system with the use of ER Diagram. Creating it will help you perceive the back end of the software. This will hold all the data that’ll enter and exit the system.
Related Articles:
- Best ER Diagram In DBMS With Examples 2020
- Shopping Cart ER Diagram
- ER Diagram for Login Process
- ER Diagram for Login and Registration Page
- ER Diagram for Face Recognition Attendance System
Inquiries
If you have inquiries or suggestions about the ER Diagram for Hotel Reservation System, just leave us your comments below. We would be glad to know to concerns and suggestions and be part of your learning.
Keep us updated, and have a Good Day!