Thesis Documentation | Online Supply and Inventory System Chapter 3
This chapter Thesis Documentation | Online Supply and Inventory System Chapter 3 a condition will be set on the software based on the usage of the software. Then, the features of the software are determined based on the needs.
Next, a data flow diagram is created to determine the flow of data from server to user. The software development tools is chosen based on the limitation and features. Then, the software flow chart is created based on the limitation and features.
Here’s the Steps on How to Make Online Supply and Inventory System Chapter 3
Online Supply and Inventory System Chapter 3
- Methodology
- Usecase Diagram
- Activity Diagram
- Context Diagram
- Data flow Diagram
- Entity Relationship Diagram
- Data Tables
- Archetectural Diagram
- Screen Design
Thesis Documentation | Online Supply and Inventory System Chapter 3 : Methodology
This chapter presents the system design of the proponent’s system.
System Development Life Cycle (SDLC)
The Software Development Life Cycle (SDLC) is very important in developing the system since it can help us to know how to use a process for planning, requirements analysis, testing, evaluation and deploying an information system.
The SDLC is used as a guide in developing the project, planning and analyzing in which the processes are in step by step procedures.
The concept of SDLC applies to a range of hardware and software configurations, as a system can be composed of hardware and software only, or a combination of both.
This space is done by step by step and was used repeatedly to accomplish the final project.
Rapid Application Development Methodology
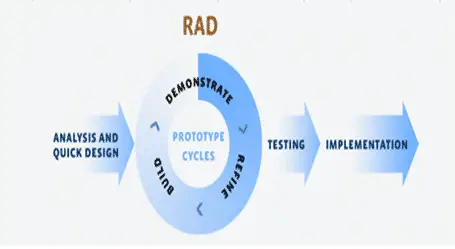
Figure 1 tells from the beginning of the research up to the last process. RAD model distributes the analysis, design, build and test phases into a series of short, iterative development cycle.
RAD makes heavy use of prototyping to make sure interested parties have a clear picture of all aspects of the system.
Rapid Application Development is easy to use as a methodology the diagram shows the step by step so that the problems that might encounter can be polished by reviewing every step.
In RAD, the functions are developed as the prototype is being integrated to make the complete process quicker it makes it easier to incorporate and understand the changes within the development.
Analysis and Quick Design
In this phase, the proponents analyzed the data they gathered and created a design that is suitable for the processed for AGRI-TRADING.
Business Modeling
This phase of software development is the stimulant of the proponents to plan a software that will aid the agri-trading. The proponents conducted an interview and observations on how the staff doing their job in a period of time.
Then, proponents asked for the process they’re doing manual when it comes to inventory and the proponents found out a problem and a need that can be addressed by the proponent’s system.
Then proponents had sited different platforms to be used for the entire development of the system that can attain the objectives of the study.
Data Modeling
In this phase, the information that has been gathered from business model is being analyzed to form a set of data objects deemed very important all throughout the process for developing a system.
The relation between these data objects are established and defined in detail in relevance to the business model.
Design Modeling
In this phase, the proponents developed a design which is user-friendly and can obtain an easy access to the field requested by the user and since one of the features of the system is web-hosted, proponent used the standard mark-up language for creating web-site or the HTML, and for the design or the CSS.
Process Modeling
In this phase, the data object sets are being executed to start the first process which is establishing the business information flow needed to achieve specific business objectives as per the business model.
The process model for any changes or enhancements to the data object set is defined in this phase.
In line with this stage of development, the proponents had created some of the methods for the system’s processes, however the proponents had been encountered some problems while developing these processes.
Yet by the availability of the information on the internet. And in agreement to this stage, the proponents had also sought for some of the further inputs vital to the system and formulate further processes. Furthermore, knowledge in programming and logic were really needed to attain this stage.
Application Generation
Generating the actual system is being describe in this phase, by using automation tools for the process to be converted into actual prototype.
The over-all development of the system in both front-end and back-end has been developed using PHP since PHP file contain text, HTML, CSS, JavaScript and PHP code.
The proponents used this platform via Sublime Text Editor and for the database of the system, the proponents had used Structured Query Language specifically MYSQL using PHPMyAdmin.
But during the development of the system the proponents used local hosting using XAMPP- Apache Server.
Testing and Implementation
This phase is the actual testing of the actual prototype, to be able to fix suddenly if there is an error found. The overall testing time is reduced in the RAD model as the prototype is independently tested during iterations.
At this stage, the proponents will conduct a series of testing of the system to the user, however, in every test done by the proponents, the user/s suggest further changes of lay-out of the system.
The proponents took a lot of testing and checking until it reaches the maximum user’s satisfaction.
Thesis Documentation | Online Supply and Inventory System Chapter 3 : Usecase Diagram
Agri-Trading Supply and Inventory Management System with SMS Notification Use Case Model
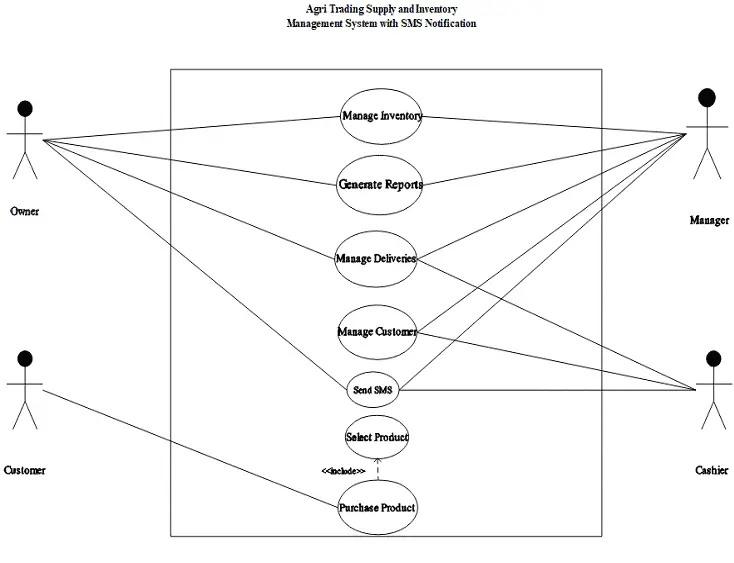
Figure 2 shows the use case of Agri-Trading Supply and Inventory Management System and the task of every actors of the system.
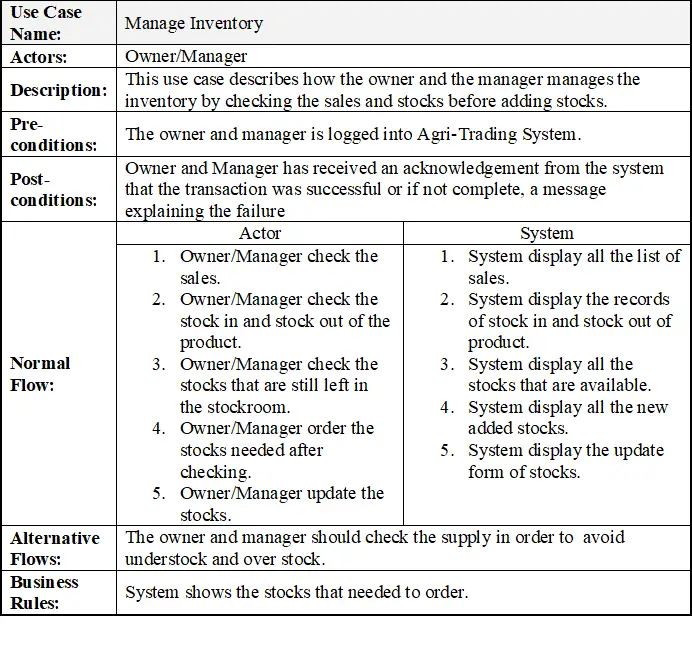
Manage Inventory
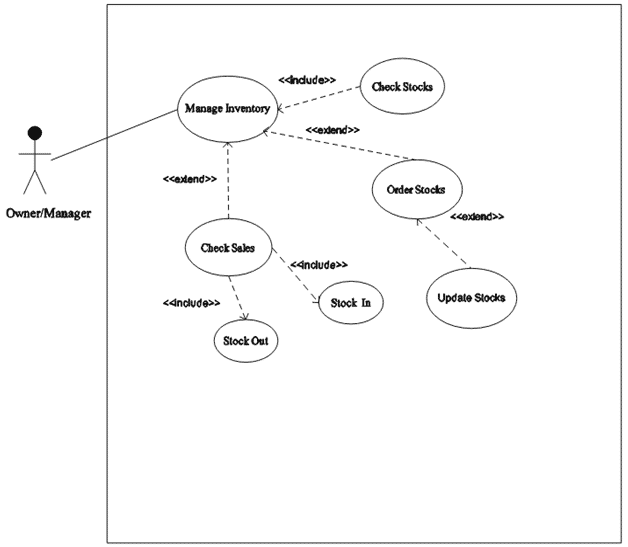
Figure 3 shows manage inventory use case diagram and how the actors manage the inventory of Agri-Trading.
Table 2: Manage Inventory Use Case Description of Agri-Trading Supply and Inventory Management System with SMS Notification.
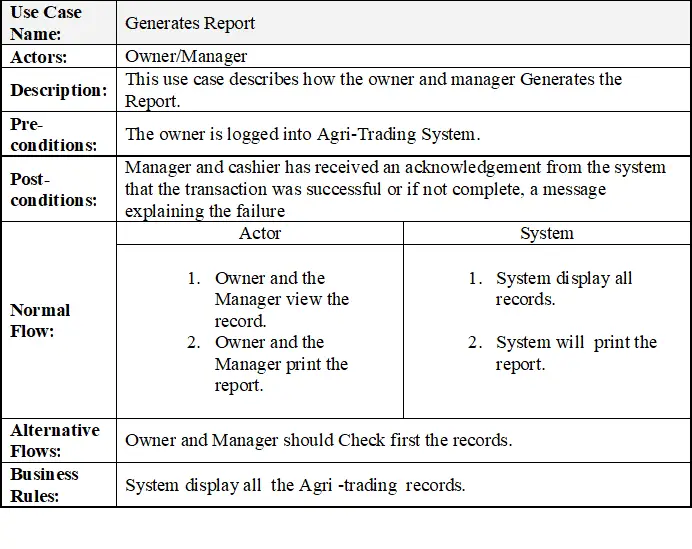
Generate Report
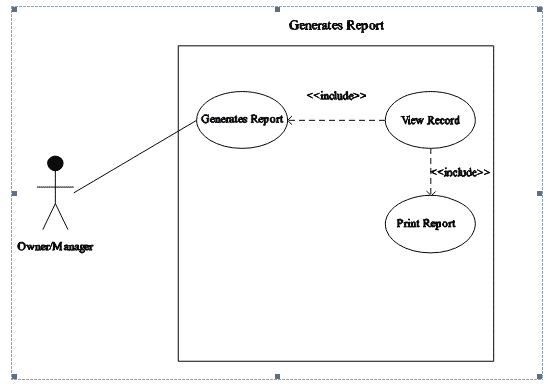
Figure 4 shows generates report use case diagram and how the actors generate report of Agri-Trading.
Table 3: Generates Reports Use Case Description of Agri-Trading Supply and Inventory Management System with SMS Notification.
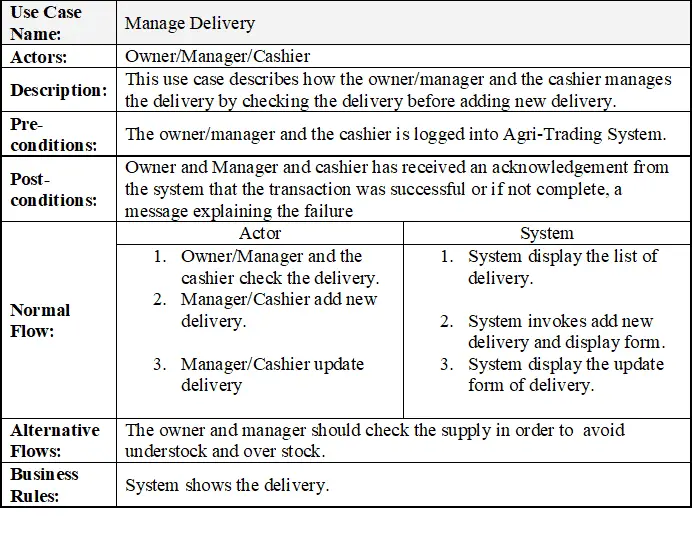
Manage Delivery
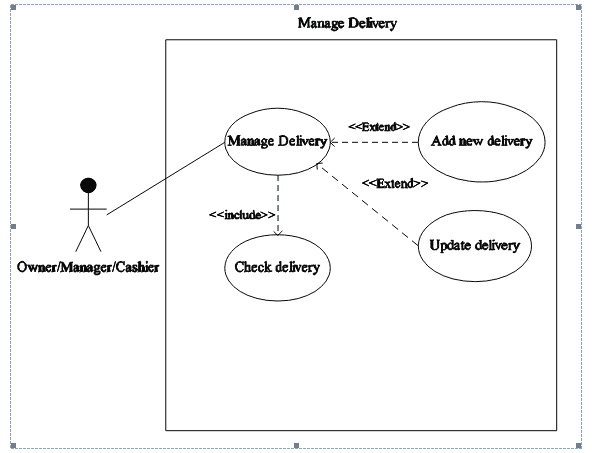
Figure 5 shows manage delivery use case diagram and how the actors manage the delivery of Agri-Trading.
Table 4: Manage Delivery Use Case Description of Agri-Trading Supply and Inventory Management System with SMS Notification.
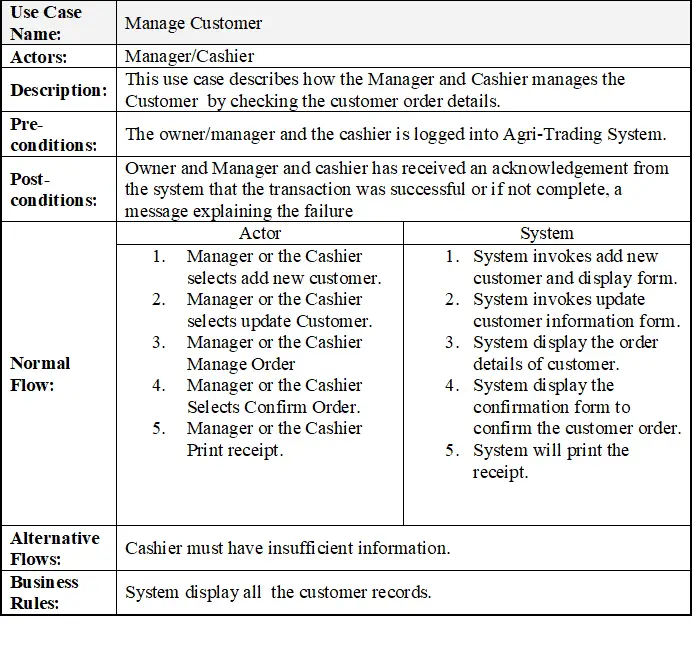
Manage Customer
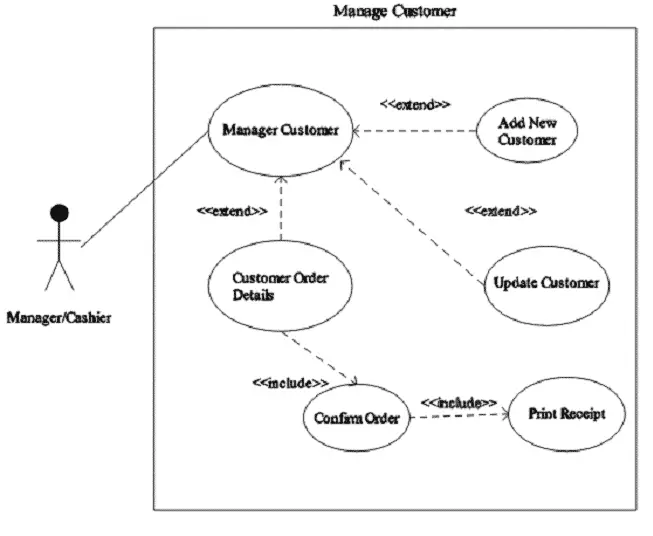
Figure 6 shows manage customer use case diagram and how the actors manage the customer of Agri-Trading.
Table 5: Manage Customer Use Case Description of Agri-Trading Supply and Inventory Management System with SMS Notification.
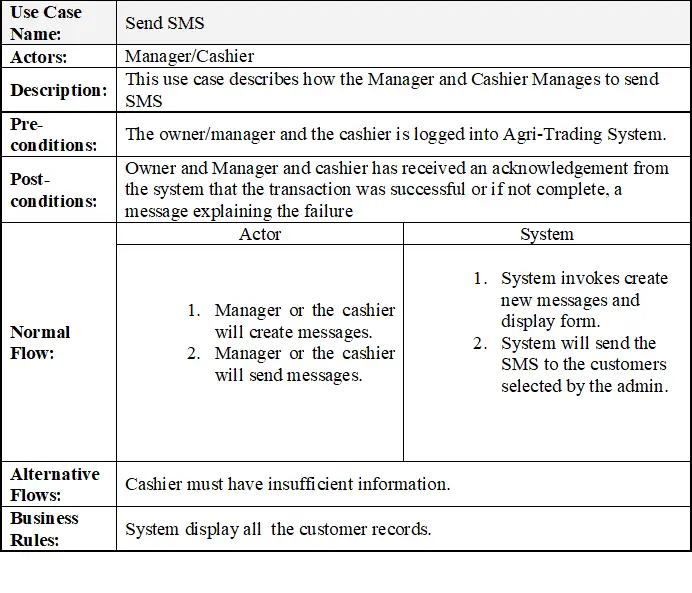
Send SMS
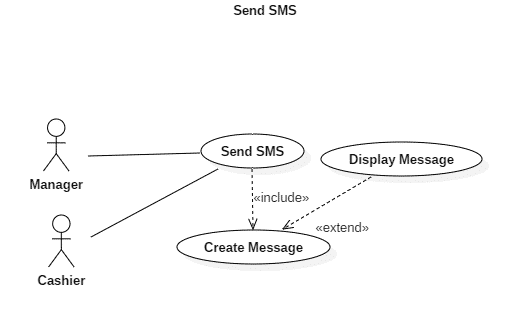
Figure 7 shows send SMS use case diagram and how the actors manage the delivery of Agri-Trading.
Table 6: Send SMS Use Case Description of Agri-Trading Supply and Inventory Management System with SMS Notification.
Thesis Documentation | Online Supply and Inventory System Chapter 3 : Activity Diagram
Activity Diagram for Ordering
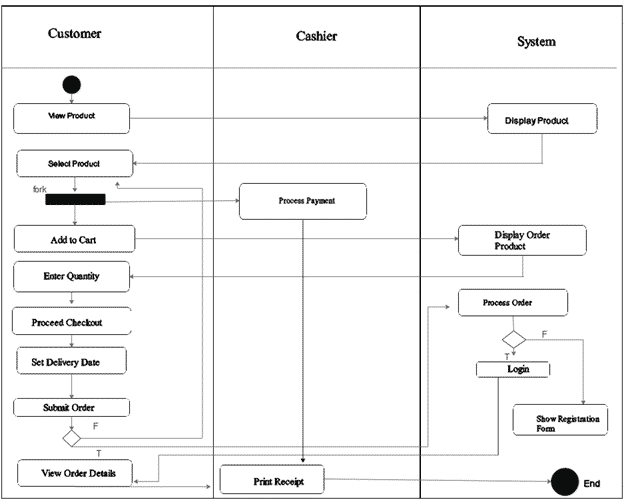
Figure 8 shows the activity diagram for ordering and the steps in ordering.
Activity Diagram for Order Confirmation
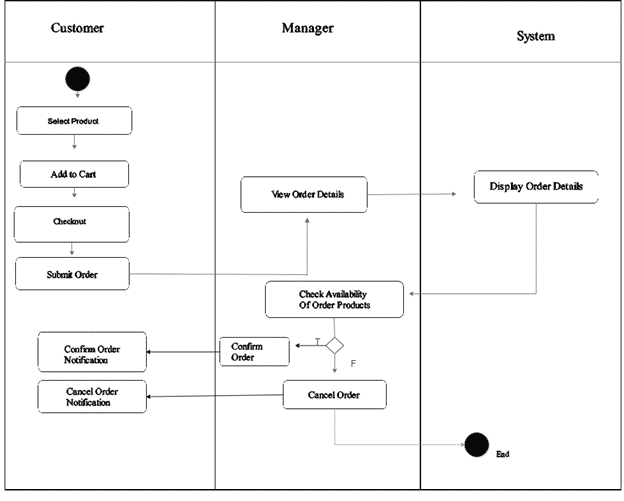
Figure 9 shows the activity diagram for order confirmation and the steps in confirming the order.
Thesis Documentation | Online Supply and Inventory System Chapter 3 : Context Diagram
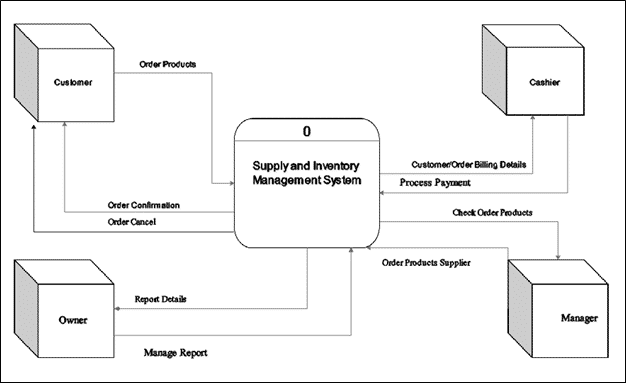
Figure 9 shows the context diagram of Agri-Trading Supply and Inventory Management System with SMS Notification.
Thesis Documentation | Online Supply and Inventory System Chapter 3 : Data Flow Diagrams

Figure 10 shows the data flow diagram of Agri-Trading Supply and Inventory Management System with SMS Notification.
Data Flow Diagram of Purchase Product (Level 1)
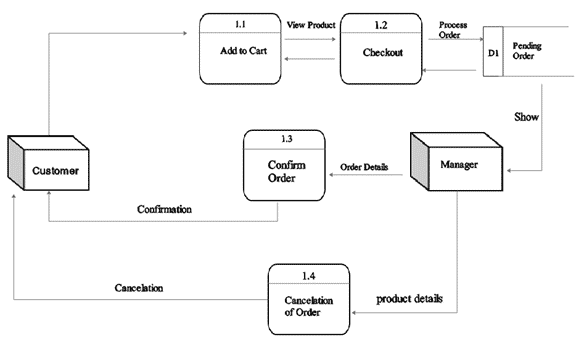
Figure 11 shows the data flow diagram of purchase product level 1 of Agri-Trading Supply and Inventory Management System with SMS Notification.
Data Flow Diagram of Inventory (Level 1)
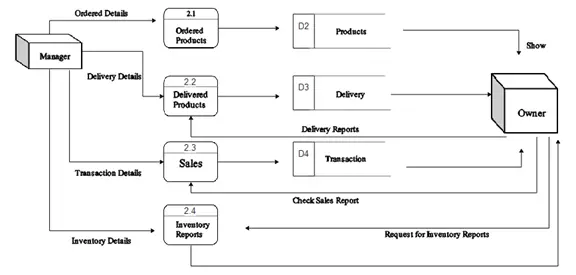
Figure 12 shows the data flow diagram of inventory level 1 of Agri-Trading Supply and Inventory Management System with SMS Notification.
Data Flow Diagram of Reports (Level 1)
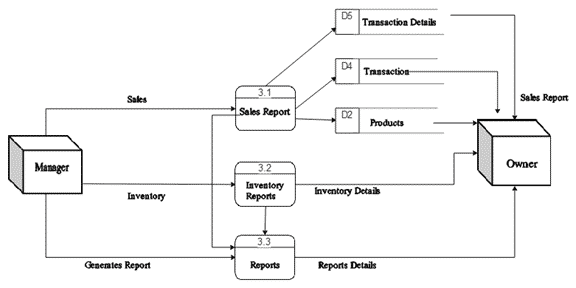
Figure 13 shows the data flow diagram of reports level 1 of Agri-Trading Supply and Inventory Management System with SMS Notification.
Data Flow Diagram of Delivery (Level 1)
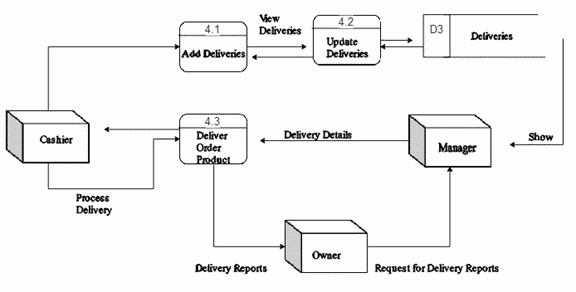
Figure 14 shows the data flow diagram of delivery level 1 of Agri-Trading Supply and Inventory Management System with SMS Notification
Thesis Documentation | Online Supply and Inventory System Chapter 3 : Entity Relationship Diagram
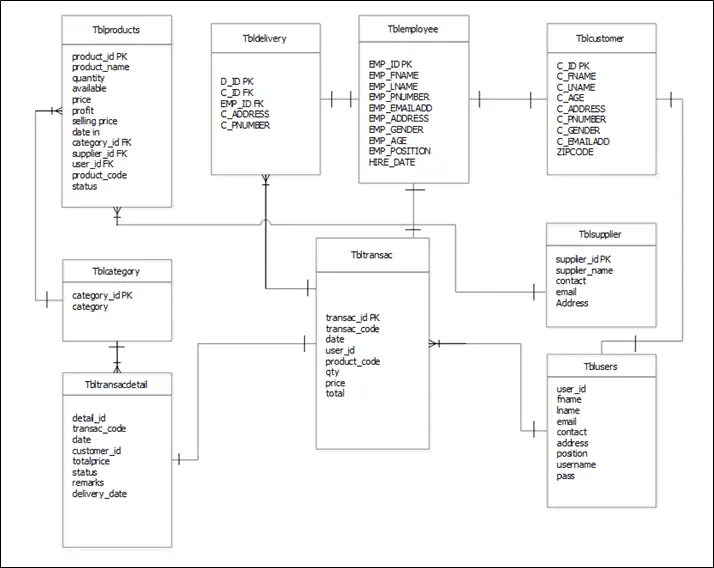
Figure 15 shows the entity relationship diagram of Agri-Trading Supply and Inventory Management System with SMS Notification
Thesis Documentation | Online Supply and Inventory System Chapter 3 : Data Dictionary
Table 6: tblcategory
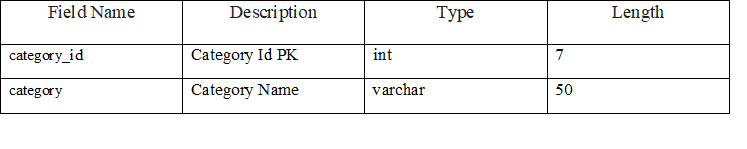
Table 6 is the table for category list. It includes category id and category name.
Table 7: tblcustomer
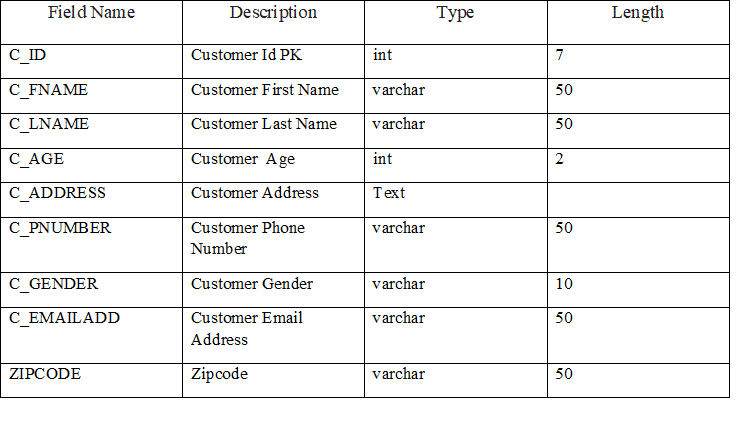
Table 7 is the table for registered customer. It shows the important data given by the customer such as the customer id in which the admin can easily identify the customer.
Table 8: tbldelivery
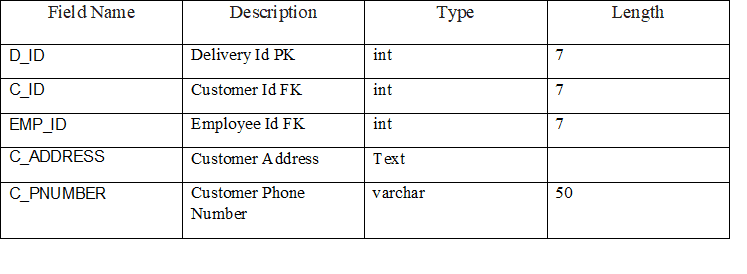
Table 8 is the table for delivery it includes delivery id and some details of customer for delivery purposes.
Table 9: tblemployees
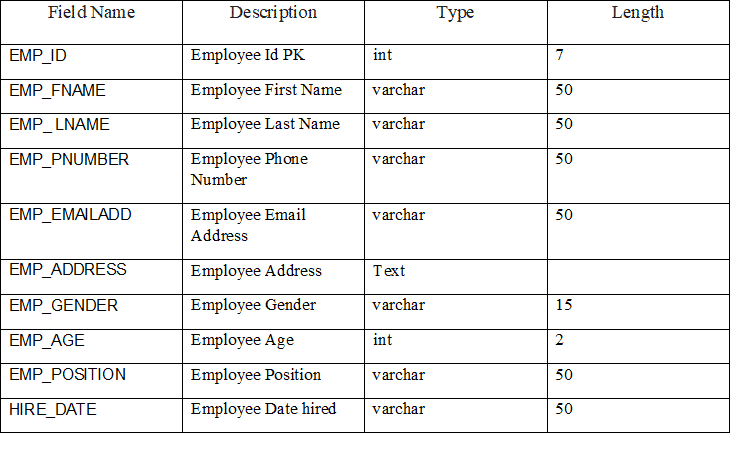
Table 9 is the table for employees. It shows the important data given by the employee such as the customer id in which the admin can easily identify the employee.
Table 10: tblproducts
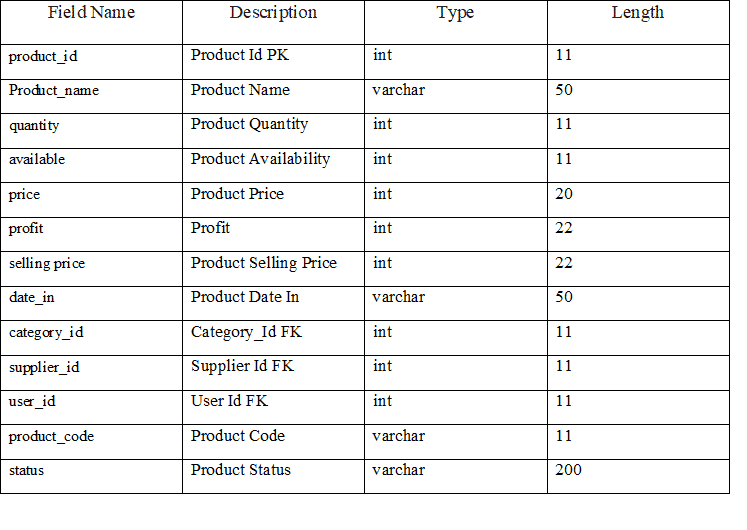
Table 10 is the table for products. It includes product id, product name so that admin will easily identify the products. It shows the important data encoded for the table of products.
Table 11: tblsupplier
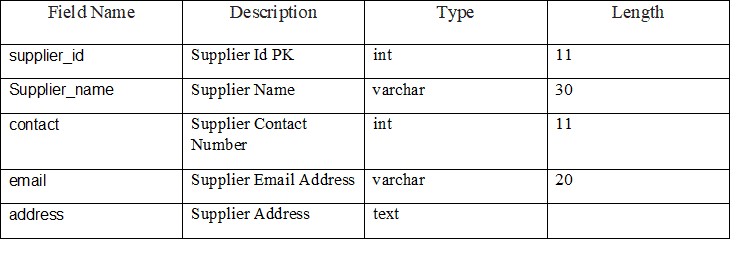
Table 11 is the table for supplier. It shows the important data given by the supplier such as the supplier id in which the admin can easily identify the supplier.
Table 12: tbltransac
Table 12 is the table for transaction. It includes transaction id, transaction code date which is really important in every transaction that admin easily tract if there are some losses.
Table 13: tbltransacdetail
Table 13 is the table for transaction details. It shows the important data from transaction detail which shows the whole information from the transaction.
Table 14: tblusers
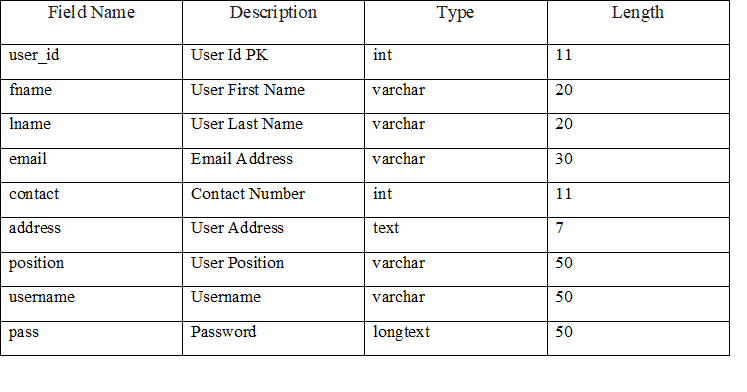
Table 14 is the table for users. It shows the important data given by the users such as the user id in which the admin can easily identify the users.
Architectural Framework
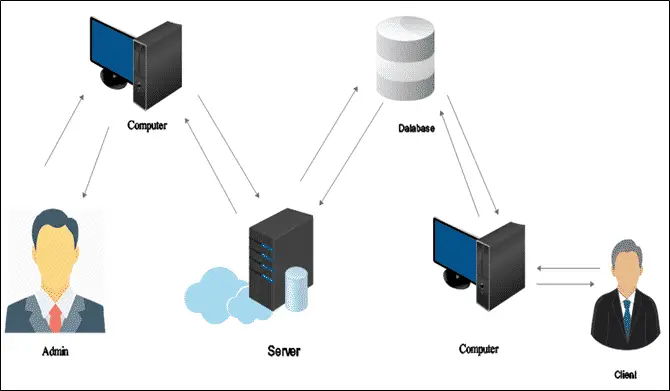
Figure 16 shows the architectural diagram of Agri-Trading Supply and Inventory Management System with SMS Notification.
Screen Layout and Design
Login Page
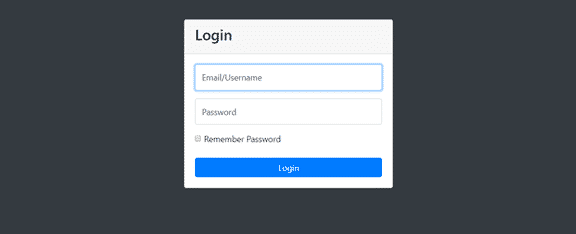
Figure 17 shows the screen design for log in page of the system for the admin side to access the system.
Client Side
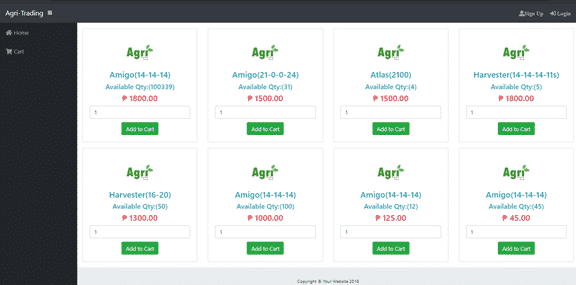
Figure 18 shows the screen design for client side of the system which they select different kinds of Agri-Trading products.
Admin Home
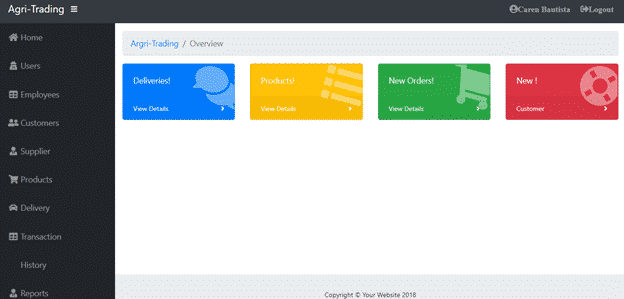
Figure 19 shows the screen design for admin home of the system for the admin side to access the different tables of the system.
User Table
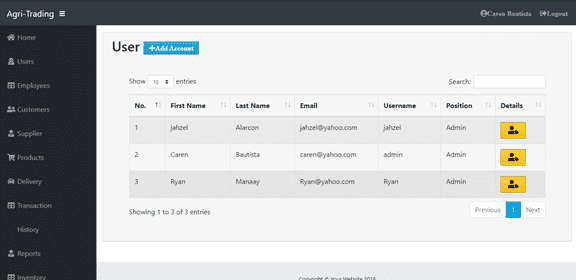
Figure 20 shows the screen design for user table of the system which will able to see those users who access the system.
Employees Table
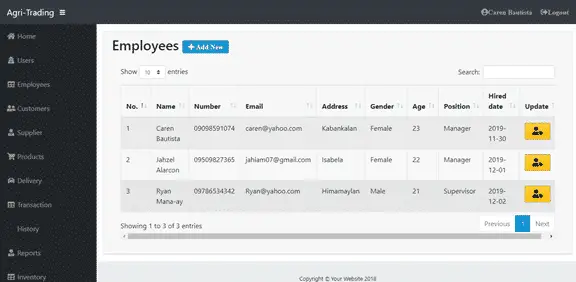
Figure 21 shows the screen design for employees table of the system.
Customer Table
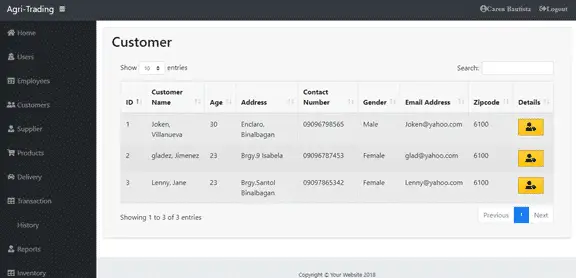
Figure 22 shows the screen design for customer table of the system
Suppliers Table
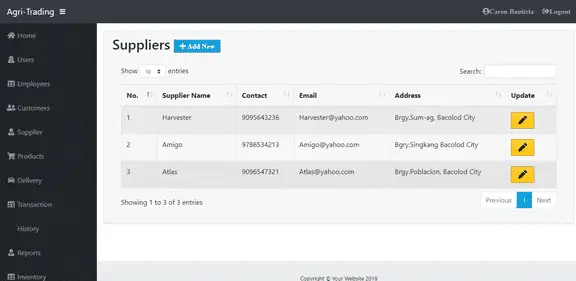
Figure 23 shows the screen design for suppliers table of the system which able to add and update supplier.
Products Table
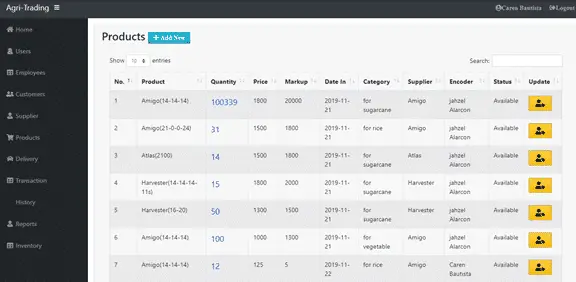
Figure 24 shows the screen design for products table of the system which will able to add new stocks and where users can update the products.
Related Article
- Chapter 3: Online Restaurant Management System project documentation
- Pharmacy Management System Thesis | Chapter 3 – Methodology
Inquiries
if you have any questions or suggestions about Thesis Documentation | Online Supply and Inventory System Chapter 3, please let’s me know by dropping your comment below.