In this tutorial, we will learn what is Excel Analysis Toolpak, as well as where we can find it. Along with we will know how to activate and install it on our Windows and Mac.
Excel data analysis toolpak
The analysis toolpak is an Excel add-in providing tools for complex data analysis. Primarily its role is to remove those detailed steps in executing certain calculations.
The good thing even if you know those detailed steps, it’s a time saver in doing a task.
Furthermore, this tool is a great help if you are having engineering or statistical data to analyze. And even use this Analysis Toolpak in applying techniques you prefer, such as generating analyze output table, summarizing or simplifying data.
For instance, if you already know what is the appropriate engineering or statistical function of data. Hence select the Tool from Excels Toolpak. Accordingly, the results will be shown on the output table and others is generated in both charts and output table.
Where is the Analysis Toolpak in Excel
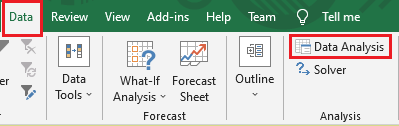
Analysis toolpak in Excel if activated can be found in Data Tab. Then under analyze group command, you’ll find it. But if not we will show you how to add this to your ribbon.
How to add Analysis Toolpak in Excel
Here are the steps to add Analysis Toolpak in Excel.
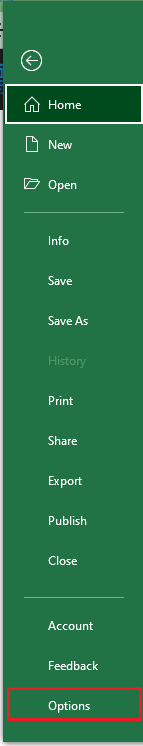
- First, on the File tab click it then find and click Options.

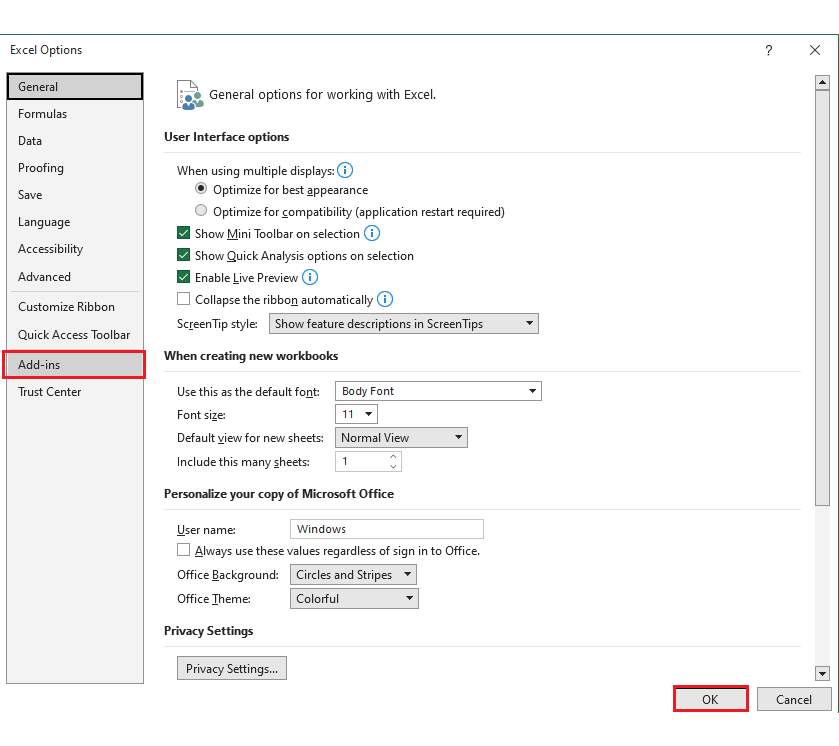
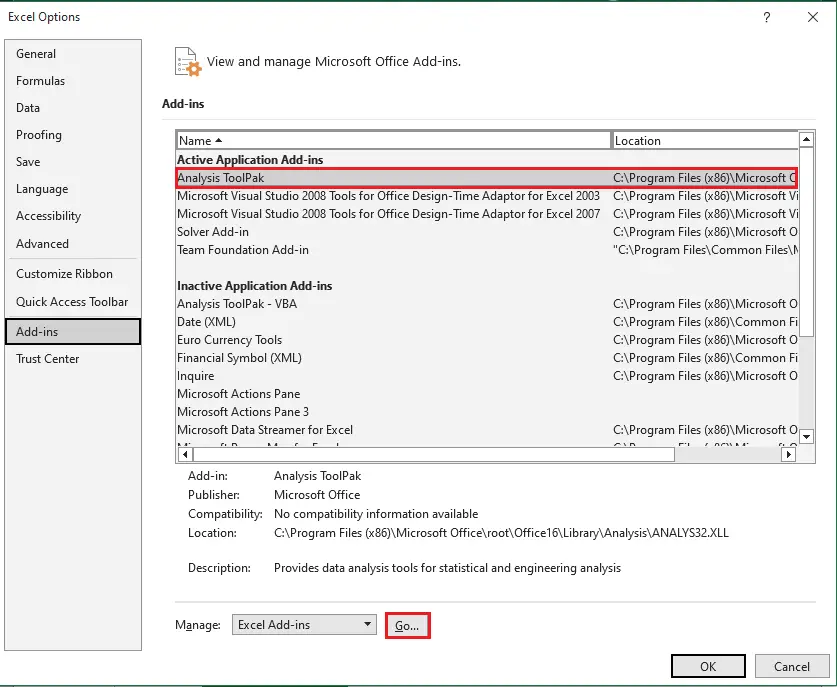
- When the dialog box appears, click the Add-Ins in the Excel options category on the left. However, when still using Excel 2007, go to Microsoft Office Button and click it, and then click Excel Options.

- In add-ins dropdown list, select the preferred add-ins then Click GO. In our case, we select Analysis toolpak.

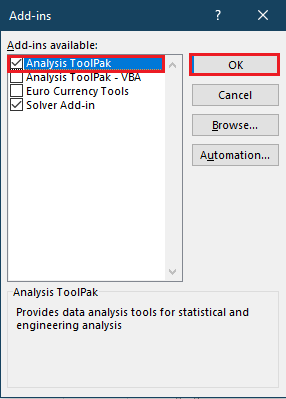
- And now in the Add-Ins dialog box, check the Analysis ToolPak check box, then click OK.

Reminder:
- However, if the Analysis Toolpak is not available in list of add-ins, click the browse command to find it.
- And if not installed on the computer click YES to install it.
How to use Analysis Toolpak in Excel
Here are the analytical tools you can use along with their purposes.
| Tool | Description |
|---|---|
| ANOVA: Single Factor | This tool determines a simple analysis of variance between the relationship of two data sets. |
| ANOVA: Two Factor with Replication | This tool is used to determine if there is a relationship between two datasets and classified into two different dimensions. |
| Anova: Two-Factor without Replication | This tool determines the usefulness when data is categorized on two different measurements as in the Two-Factor case With Replication. |
| Correlation | This tool was used in more than two variable measurements of every N subject. |
| Covariance | This analysis tool is used to calculate the average product deviation value from the mean of the data set. |
| Descriptive Statistics | Create a report of univariate statistics for the selected data. |
| Exponential Smoothing | Smooths out irregularities (peaks and valleys) in data, to easily recognize trends. More recent data is weighted more heavily. |
| F-Test Two Sample for Variances | This analysis tool compares the variances between two groups of data. |
| Fourier Analysis | This tool using Fast and Fourier Transform solves problems in linear systems and analyzes periodic data and transforms data. |
| Histogram | The Histogram analysis tool is used to show the distribution of values in specified ranges. |
| Moving Average | Calculates a moving average to allow you to smooth out a data series that contains peaks and outliers. |
| Random Number Generation | Creates a number of several types of random numbers including Uniform, Normal, Bernoulli, Poisson, Patterned and Discrete. |
| Rank and Percentile | Creates a table which ranks numbers from highest to lowest and provides a percentile value of each number relative to the other numbers within the data set. |
| Regression | This uses LINEST function to determine if the single dependent variable is affected by the values of one or more independent variables. |
| Sampling | It is a sample population, either random or periodic. |
| t-Test: Paired Two Sample for Means | Paired two-sample student’s T-Test. Each Two-Sample t-Test analysis tool tests for equality of the population means that underlie each sample. |
| T-Test: Two Sample assuming equal Variances | It is used to test data to see if there is statistical significance or if the results may have occurred randomly. |
| T-Test: Two Sample assuming unequal Variances | This t-Test form assumes that the two datasets are from distributions where the variances are unequal. This is called a “heteroscedastic t-Test”. |
| Z-Test: Two Sample for Means | Two-sample Z-test for is a statistical hypothesis testing technique that is used to determine if the difference between the two population means is not statistically significant. |
How to add Analysis Toolpak in Excel Mac
To load Analysis Toolpak in Excel Mac, all you have to do is the following:
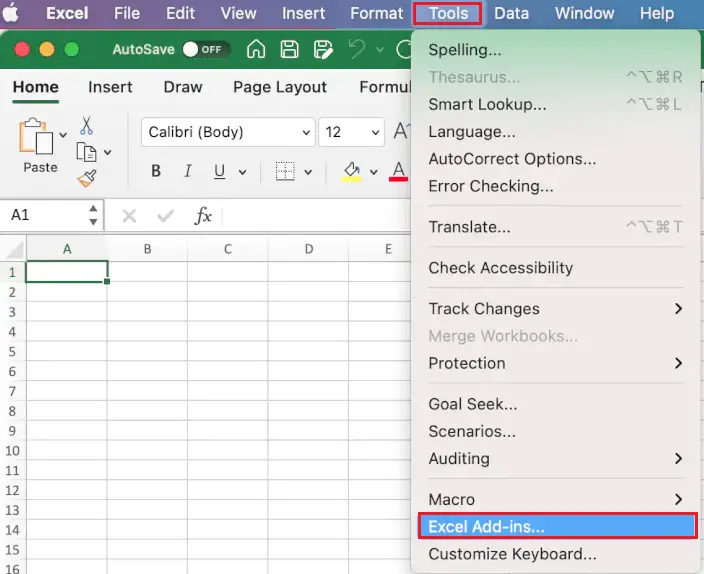
First, on the Tools menu click then find and click Excel add-ins on the list.
Whenever the Excel add-in dialog box appears, check the Analysis ToolPak check box, and then click OK.
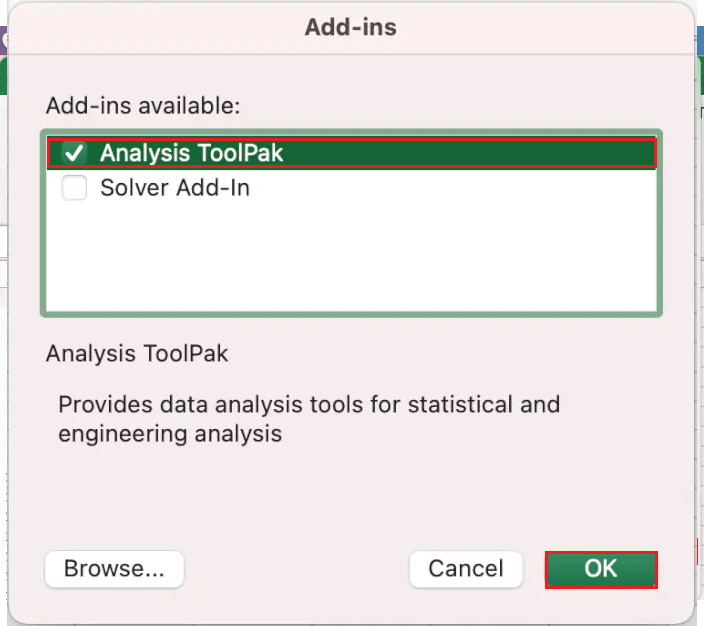
If Analysis ToolPak is not shown in the Add-Ins available box, click the Browse command to find it.
How to install Analysis Toolpak in Excel
Here are the following steps you can consider in installing Analysis toolpak in your Excel 2016/2019:
- Click your File Tab.
- Find and Click Option. Then the options dialog box will display.
- Select Add-Ins. It locates on the left category.
- Then locate and click Analysis ToolPak.
- At the bottom part, you will see the manage drop-down. Choose Excel-Add-ins and click the Go button.
- Another dialog box will and all available Add-ins will be displayed. Check Analysis Toolpak and click OK.
- Your analysis ToolPak is already loaded now. You see on the Data tab under the analysis group of command.
Conclusion
In conclusion, the article Analysis toolpak of Microsoft Excel can be activated through the given guide. Besides that, this analysis toolpak we can find in data analysis is a great help in analyzing data. Especially statistical and engineering datasets.
I hope this tutorial helps you in doing your worksheets and analyzing data.
Thank you for reading 🙂